TCF Bank 2006 Annual Report Download - page 51
Download and view the complete annual report
Please find page 51 of the 2006 TCF Bank annual report below. You can navigate through the pages in the report by either clicking on the pages listed below, or by using the keyword search tool below to find specific information within the annual report.-
 1
1 -
2
-
3
-
4
-
5
-
6
-
7
-
8
-
9
-
10
-
11
-
12
-
13
-
14
-
15
-
16
-
17
-
18
-
19
-
20
-
21
-
22
-
23
-
24
-
25
-
26
-
27
-
28
-
29
-
30
-
31
-
32
-
33
-
34
-
35
-
36
-
37
-
38
-
39
-
40
-
 41
41 -
 42
42 -
 43
43 -
 44
44 -
 45
45 -
 46
46 -
 47
47 -
 48
48 -
 49
49 -
 50
50 -
 51
51 -
 52
52 -
 53
53 -
 54
54 -
 55
55 -
 56
56 -
 57
57 -
 58
58 -
 59
59 -
 60
60 -
 61
61 -
62
-
63
-
64
-
65
-
66
-
67
-
68
-
69
-
70
-
71
-
72
-
73
-
74
-
75
-
76
-
77
-
78
-
79
-
80
-
81
-
82
-
83
-
84
-
85
-
86
-
87
-
88
-
89
-
90
-
91
-
92
-
93
-
94
-
95
-
96
-
97
-
98
-
99
-
100
-
101
-
102
-
103
-
104
-
105
-
106
-
107
-
108
-
109
-
110
-
111
-
112
 |
 |

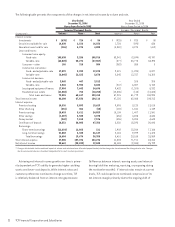
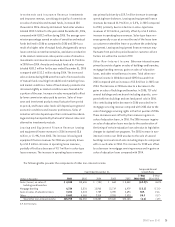
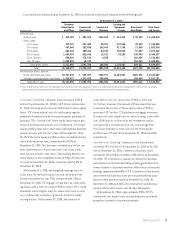
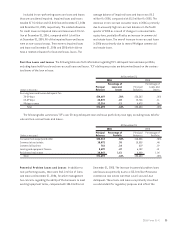
The leasing and equipment finance portfolio increased
$314.4 million from December 31, 2005 to $1.8 billion at
December 31, 2006. Total loan and lease originations and
purchases for TCF Equipment Finance and Winthrop Resources
were $1.1 billion for 2006, compared with $845.8 million
for 2005. The backlog of approved transactions increased
slightly to $249.7 million at December 31, 2006, from $249.2
million at December 31, 2005. TCF’s leasing activity is subject
to risk of cyclical downturns and other adverse economic
developments. In an adverse economic environment, there
may be a decline in the demand for some types of equipment,
resulting in a decline in the amount of new equipment being
placed into service as well as a decline in equipment values
for equipment previously placed in service. Declines in value
of equipment under lease increase the potential for impair-
ment losses and credit losses, due to diminished collateral
value, and may result in lower sales-type revenue at the end
of the contractual lease term. See Note 1 to Consolidated
Financial Statements-Policies Related to Critical Accounting
Estimates for information on lease accounting.
At December 31, 2006 and 2005, $53.7 million, and
$55.2 million, respectively, of TCF’s lease portfolio, were
discounted on a non-recourse basis with third-party financial
institutions and consequently TCF retains no credit risk on
such amounts. The leasing and equipment finance portfolio
tables above include lease residuals. Lease residuals
represent the estimated fair value of the leased equipment
at the expiration of the initial term of the transaction and
are reviewed on an ongoing basis. Any downward revisions
are recorded in the periods in which they become known.
At December 31, 2006, lease residuals totaled $34.7 million,
compared with $32.9 million at December 31, 2005.
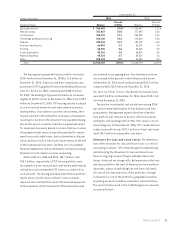
Residential Real Estate Residential real estate loans
were $627.8 million at December 31, 2006, down $142.7 mil-
lion from December 31, 2005.
The decline in residential real estate loans during 2006
was due to normal amortization of loan balances and loan
prepayments. Management expects that the residential
loan portfolio will continue to decline, which will provide
funding for anticipated growth in other loan, lease or invest-
ment categories. At December 31, 2006, TCF’s residential real
estate loan portfolio was $522.1 million in fixed-rate loans
and $105.7 million in adjustable-rate loans.
Allowance for Loan and Lease Losses The determina-
tion of the allowance for loan and lease losses is a critical
accounting estimate. TCF’s methodologies for determining
and allocating the allowance for loan and lease losses
focus on ongoing reviews of larger individual loans and
leases, historical net charge-offs, delinquencies in the loan
and lease portfolio, the level of impaired and non-perform-
ing assets, values of underlying loan and lease collateral,
the overall risk characteristics of the portfolios, changes
in character or size of the portfolios, geographic location,
prevailing economic conditions and other relevant factors.
The various factors used in the methodologies are reviewed
on a periodic basis.
31
2006 Form10-K
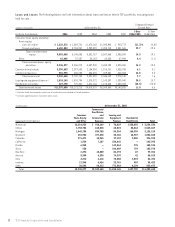
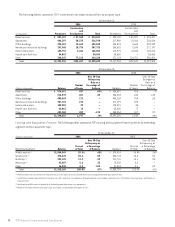
At December 31,
(Dollars in thousands) 2006 2005
Percent Percent
Equipment Type Balance of Total Balance of Total
Specialty vehicles $ 344,855 19.0% $ 257,497 17.1%
Manufacturing 327,057 18.0 277,895 18.5
Construction 310,323 17.1 236,939 15.8
Technology and data processing 260,146 14.3 222,623 14.8
Medical 230,153 12.7 199,729 13.3
Furniture and fixtures 66,999 3.7 60,278 4.0
Printing 65,545 3.6 58,600 3.9
Trucks and trailers 55,241 3.0 56,824 3.8
Material handling 49,722 2.7 39,814 2.6
Other 108,124 5.9 93,595 6.2
Total $1,818,165 100.0% $1,503,794 100.0%