TCF Bank 2006 Annual Report Download - page 46
Download and view the complete annual report
Please find page 46 of the 2006 TCF Bank annual report below. You can navigate through the pages in the report by either clicking on the pages listed below, or by using the keyword search tool below to find specific information within the annual report.-
 1
1 -
2
-
3
-
4
-
5
-
6
-
7
-
8
-
9
-
10
-
11
-
12
-
13
-
14
-
15
-
16
-
17
-
18
-
19
-
20
-
21
-
22
-
23
-
24
-
25
-
26
-
27
-
28
-
29
-
30
-
31
-
32
-
33
-
34
-
35
-
 36
36 -
 37
37 -
 38
38 -
 39
39 -
 40
40 -
 41
41 -
 42
42 -
 43
43 -
 44
44 -
 45
45 -
 46
46 -
 47
47 -
 48
48 -
 49
49 -
 50
50 -
 51
51 -
 52
52 -
 53
53 -
 54
54 -
 55
55 -
 56
56 -
57
-
58
-
59
-
60
-
61
-
62
-
63
-
64
-
65
-
66
-
67
-
68
-
69
-
70
-
71
-
72
-
73
-
74
-
75
-
76
-
77
-
78
-
79
-
80
-
81
-
82
-
83
-
84
-
85
-
86
-
87
-
88
-
89
-
90
-
91
-
92
-
93
-
94
-
95
-
96
-
97
-
98
-
99
-
100
-
101
-
102
-
103
-
104
-
105
-
106
-
107
-
108
-
109
-
110
-
111
-
112
 |
 |

Compensation and Employee Benefits Compensation
and employee benefits, representing 52.7%, 53.8% and 55.8%
of total non-interest expense in 2006, 2005 and 2004, respec-
tively, increased $15.3 million, or 4.7%, in 2006, and $3.7
million, or 1.1%, in 2005. The $12.2 million increase in com-
pensation expense from 2005 was primarily due to a $11.5
million increase in the banking segment of which $6.6 million
was attributable to branch expansion. The 2005 increase in
compensation expense of $1.4 million was primarily due to
continued branch expansion, partially offset by decreases
in mortgage banking and commissions and incentives.
Employee benefits and payroll taxes totaled $55.1 mil-
lion in 2006, up $3.1 million from 2005, primarily due to
an increase of $1.4 million in health care plan expense,
an increase of $849 thousand in payroll tax expense and a
$552 thousand increase in retirement plan expenses. In
2005, employee benefits and payroll expense increased
$2.3 million, primarily due to an increase in retirement ben-
efits expense of $1.9 million and an increase in payroll taxes
of $1.5 million, partially offset by a decrease of $1.8 million
in healthcare plan expenses. See Note 16 of Notes to
Consolidated Financial Statements for further information
on postretirement plans.
Occupancy and Equipment Occupancy and equipment
expenses increased $10.7 million in 2006 and $8.3 million in
2005. These increases were primarily due to costs associated
with branch expansion.
Advertising and Promotions Advertising and promo-
tions expense increased $1.2 million in 2006 following a
decrease of $662 thousand in 2005. The increase in 2006
was primarily due to a $1.4 million increase in promotional
expenses for new customers, partially offset by a $827
thousand decrease in advertising. The decrease in 2005 was
primarily due to a $3.7 million decrease in marketing and
promotions, partially offset by an increase of $2.1 million
in loyalty program expenses.
Operating Lease Depreciation Operating lease
depreciation totaled $14.3 million for 2006, up from $7.3
million and $1.8 million for 2005 and 2004, respectively.
The increase in depreciation was primarily driven by growth
in average operating lease balances.
Other Non-Interest Expense Other non-interest
expense increased $8 million, or 5.6%, in 2006, primarily
driven by a $2.3 million increase in card and internet
processing expenses related to transaction increases and
Gains on Sales of Securities Available for Sale Gains on securities available for sale of $10.7 million and $22.6 mil-
lion were recognized on the sales of $1 billion and $1.4 billion in mortgage-backed securities in 2005 and 2004, respectively.
There were no sales of securities available for sale in 2006.
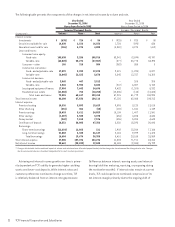
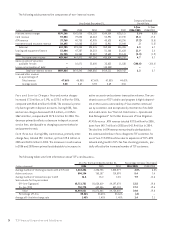
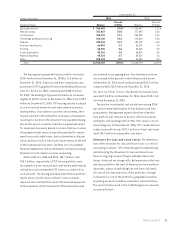
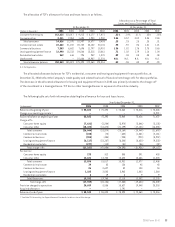
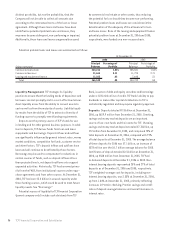
Non-Interest Expense Non-interest expense increased $42.3 million, or 7%, in 2006, and $28.3 million, or 4.9%, in 2005.
The following table presents the components of non-interest expense.
Compound Annual
Year Ended December 31, Growth Rate
1-Year 5-Year
(Dollars in thousands) 2006 2005 2004 2003 2002 2006/2005 2006/2001
Compensation $286,722 $274,523 $273,083 $256,447 $254,341 4.4% 4.1%
Employee benefits and payroll taxes 55,135 52,003 49,741 46,357 39,954 6.0 11.0
Total compensation and
employee benefits 341,857 326,526 322,824 302,804 294,295 4.7 5.1
Occupancy and equipment 114,618 103,900 95,617 88,423 83,131 10.3 7.8
Advertising and promotions 26,926 25,691 26,353 25,536 21,894 4.8 5.2
Operating lease depreciation 14,347 7,335 1,843 3,320 3,241 95.6 27.3
Other 151,449 143,484 132,037 133,342 130,415 5.6 2.9
Total non-interest expense $649,197 $606,936 $578,674 $553,425 $532,976 7.0 5.3
26 TCF Financial Corporation and Subsidiaries