TCF Bank 2006 Annual Report Download - page 72
Download and view the complete annual report
Please find page 72 of the 2006 TCF Bank annual report below. You can navigate through the pages in the report by either clicking on the pages listed below, or by using the keyword search tool below to find specific information within the annual report.-
 1
1 -
2
-
3
-
4
-
5
-
6
-
7
-
8
-
9
-
10
-
11
-
12
-
13
-
14
-
15
-
16
-
17
-
18
-
19
-
20
-
21
-
22
-
23
-
24
-
25
-
26
-
27
-
28
-
29
-
30
-
31
-
32
-
33
-
34
-
35
-
36
-
37
-
38
-
39
-
40
-
41
-
42
-
43
-
44
-
45
-
46
-
47
-
48
-
49
-
50
-
51
-
52
-
53
-
54
-
55
-
56
-
57
-
58
-
59
-
60
-
61
-
 62
62 -
 63
63 -
 64
64 -
 65
65 -
 66
66 -
 67
67 -
 68
68 -
 69
69 -
 70
70 -
 71
71 -
 72
72 -
 73
73 -
 74
74 -
 75
75 -
 76
76 -
 77
77 -
 78
78 -
 79
79 -
 80
80 -
 81
81 -
 82
82 -
83
-
84
-
85
-
86
-
87
-
88
-
89
-
90
-
91
-
92
-
93
-
94
-
95
-
96
-
97
-
98
-
99
-
100
-
101
-
102
-
103
-
104
-
105
-
106
-
107
-
108
-
109
-
110
-
111
-
112
 |
 |

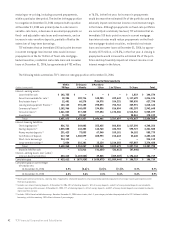
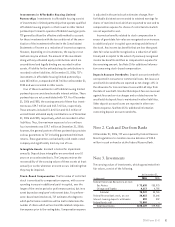
The investments in FHLB stock are required investments
related to TCF’s borrowings from these banks. All new FHLB
borrowing activity since 2000 is done with the FHLB of Des
Moines. FHLBs obtain their funding primarily through
issuance of consolidated obligations of the Federal Home
Loan Bank System. The U.S. Government does not guarantee
these obligations, and each of the 12 FHLBs are generally
jointly and severally liable for repayment of each other’s
debt. Therefore, TCF’s investments in these banks could be
adversely impacted by the operations of the other FHLBs.
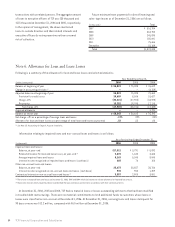
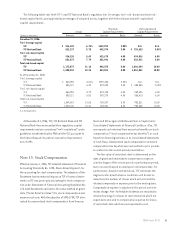
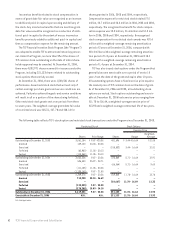
The carrying values and yields on investments at December
31, 2006, by contractual maturity, are shown below.
Carrying
(Dollars in thousands) Value Yield
Due in one year or less $ 71,859 5.21%
No stated maturity (1) 98,270 4.55
Total $170,129 4.83
(1) Balance represents Federal Reserve Bank and Federal Home Loan Bank stock,
required regulatory investments.
52 TCF Financial Corporation and Subsidiaries
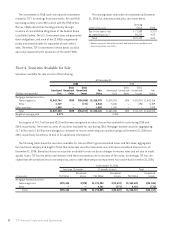
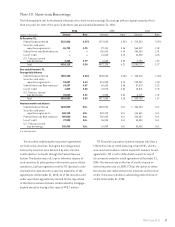
Note 4. Securities Available for Sale
Securities available for sale consist of the following.
At December 31,
2006 2005
Gross Gross Gross Gross
Amortized Unrealized Unrealized Fair Amortized Unrealized Unrealized Fair
(Dollars in thousands) Cost Gains Losses Value Cost Gains Losses Value
Mortgage-backed securities:
Federal agencies $1,843,744 $880 $(34,046) $1,810,578 $1,675,203 $874 $(33,921) $1,642,156
Other 4,719 – (171) 4,548 5,655 – (196) 5,459
Other securities 1,000 – – 1,000 1,000 – – 1,000
Total $1,849,463 $880 $(34,217) $1,816,126 $1,681,858 $874 $(34,117) $1,648,615
Weighted-average yield 5.37% 5.26%
Gross gains of $10.7 million and $22.6 million were recognized on sales of securities available for sale during 2005 and
2004, respectively. There were no sales of securities available for sale during 2006. Mortgage-backed securities aggregating
$1.7 billion and $1.5 billion were pledged as collateral to secure certain deposits and borrowings at December 31, 2006 and
2005, respectively (see Notes 10 and 11 for additional information).
The following table shows the securities available for sale portfolio’s gross unrealized losses and fair value, aggregated
by investment category and length of time that individual securities have been in a continuous unrealized loss position, at
December 31, 2006. Unrealized losses on securities available for sale are due to changes in interest rates and not due to credit
quality issues. TCF has the ability and intent to hold these investments until a recovery of fair value. Accordingly, TCF has con-
cluded that the unrealized losses are temporary, and no other than temporary impairment has occurred at December 31, 2006.
At December 31, 2006
Less than 12 months 12 months or more Total
Unrealized Unrealized Unrealized
(In thousands) Fair Value Losses Fair Value Losses Fair Value Losses
Mortgage-backed securities:
Federal agencies $270,636 $(570) $1,271,984 $(33,476) $1,542,620 $(34,046)
Other – – 4,101 (171) 4,101 (171)
Total $270,636 $(570) $1,276,085 $(33,647) $1,546,721 $(34,217)