TCF Bank 2006 Annual Report Download - page 57
Download and view the complete annual report
Please find page 57 of the 2006 TCF Bank annual report below. You can navigate through the pages in the report by either clicking on the pages listed below, or by using the keyword search tool below to find specific information within the annual report.-
 1
1 -
2
-
3
-
4
-
5
-
6
-
7
-
8
-
9
-
10
-
11
-
12
-
13
-
14
-
15
-
16
-
17
-
18
-
19
-
20
-
21
-
22
-
23
-
24
-
25
-
26
-
27
-
28
-
29
-
30
-
31
-
32
-
33
-
34
-
35
-
36
-
37
-
38
-
39
-
40
-
41
-
42
-
43
-
44
-
45
-
46
-
 47
47 -
 48
48 -
 49
49 -
 50
50 -
 51
51 -
 52
52 -
 53
53 -
 54
54 -
 55
55 -
 56
56 -
 57
57 -
 58
58 -
 59
59 -
 60
60 -
 61
61 -
 62
62 -
 63
63 -
 64
64 -
 65
65 -
 66
66 -
 67
67 -
68
-
69
-
70
-
71
-
72
-
73
-
74
-
75
-
76
-
77
-
78
-
79
-
80
-
81
-
82
-
83
-
84
-
85
-
86
-
87
-
88
-
89
-
90
-
91
-
92
-
93
-
94
-
95
-
96
-
97
-
98
-
99
-
100
-
101
-
102
-
103
-
104
-
105
-
106
-
107
-
108
-
109
-
110
-
111
-
112
 |
 |

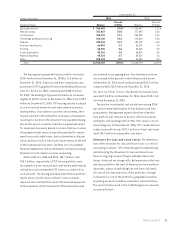
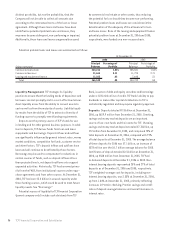
Branches Key to TCF’s growth is its continued investment
in new branch expansion. New branches are an important
source of new customers in both deposit products and
consumer lending products. While supermarket branches
continue to play an important role in TCF’s expansion strat-
egy, the opportunity to add new supermarket branches
within TCF’s markets has slowed. Therefore, TCF will continue
new branch expansion by opening more traditional branches.
Although traditional branches require a higher initial invest-
ment than supermarket branches, they ultimately attract
more customers and become larger and potentially more
profitable. During 2006, TCF opened 19 new branches. The
focus on opening new branches will continue in 2007 with
the planned opening of 20 branches, including 11 new tra-
ditional branches, six new supermarket branches and three
campus branches. TCF opened its first branch in the Phoenix,
Arizona metropolitan area in December 2006. TCF closed 19
branches in 2006 primarily due to the sale of supermarket
stores and consolidation of branches.
In order to improve the customer experience and enhance
deposit and loan growth, TCF also plans to relocate nine
branches, including seven traditional branches and two
supermarket branches to improved locations and new facil-
ities, and to remodel 15 existing supermarket branches in
2007. In connection with the traditional branch relocation
activities, the sale of existing real estate will produce signif-
icant gains in 2007, which will more than offset the increased
operating costs of the new branches.
In November 2006, TCF entered into a definitive agreement
to sell 10 outstate Michigan branches with approximately
$235 million of deposits. TCF expects to record a pre-tax gain
of the sale of these branches of approximately $29 million,
or 15 cents per diluted share after-tax in 2007. The sale of
these branches is subject to regulatory approval.
37
2006 Form10-K
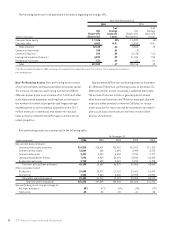
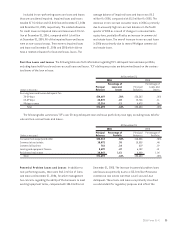
Borrowings Borrowings totaled $3.6 billion at December
31, 2006, up $605.4 million from December 31, 2005. The
increase was primarily due to the growth in assets exceed-
ing the growth in deposits by $641 million. In February 2006,
TCF Bank issued $75 million of subordinated notes due in
2016 with a fixed-rate coupon of 5.5%. These notes qualify
as Tier 2 or supplemental capital for regulatory purposes,
subject to certain limitations. TCF National Bank paid the
proceeds from the offering to TCF as a permanent capital
distribution.
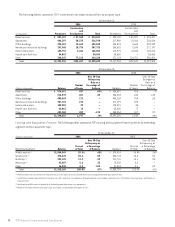
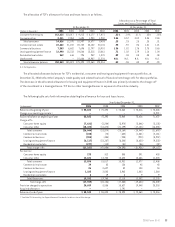
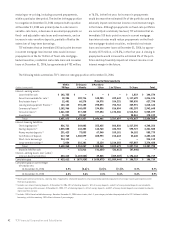
At December 31, 2006, 148, or 33%, of TCF’s 453 branches were opened since January 1, 2001. Additional information
regarding TCF’s branches opened since January 1, 2001 is displayed in the table below.
Percentage
At or For the Year Ended December 31, Increase
(Dollars in thousands) 2006 2005 2004 2003 2002 2006/2005
Number of new branches opened during the year:
Traditional 10 18 19 14 12 N.M.
Supermarket 5 7 11 5 15 N.M.
Campus 4 3 –––N.M.
Total 19 28 30 19 27 N.M.
Number of new branches at year end:
Traditional 78 68 50 31 17 N.M.
Supermarket 63 58 51 40 35 N.M.
Campus 7 3 –––N.M.
Total 148 129 101 71 52 N.M.
Percent of total branches 32.7% 28.1% 22.2% 15.7% 11.5% N.M.
Number of deposit accounts 389,236 287,474 202,692 128,897 79,600 35.4%
Deposits:
Checking $ 451,926 $364,494 $251,365 $119,379 $ 52,593 24.0
Savings 356,760 274,623 120,647 71,746 56,583 29.9
Money market 42,461 24,993 14,388 13,311 7,709 69.9
Subtotal 851,147 664,110 386,400 204,436 116,885 28.2
Certificates of deposit 467,568 316,235 56,033 33,584 25,181 47.9
Total deposits $1,318,715 $980,345 $442,433 $238,020 $142,066 34.5
Total fees and other revenue for the year $ 71,587 $ 55,028 $ 38,016 $ 17,680 $ 7,756 30.1
N.M. Not Meaningful.