TCF Bank 2006 Annual Report Download - page 65
Download and view the complete annual report
Please find page 65 of the 2006 TCF Bank annual report below. You can navigate through the pages in the report by either clicking on the pages listed below, or by using the keyword search tool below to find specific information within the annual report.-
 1
1 -
2
-
3
-
4
-
5
-
6
-
7
-
8
-
9
-
10
-
11
-
12
-
13
-
14
-
15
-
16
-
17
-
18
-
19
-
20
-
21
-
22
-
23
-
24
-
25
-
26
-
27
-
28
-
29
-
30
-
31
-
32
-
33
-
34
-
35
-
36
-
37
-
38
-
39
-
40
-
41
-
42
-
43
-
44
-
45
-
46
-
47
-
48
-
49
-
50
-
51
-
52
-
53
-
54
-
 55
55 -
 56
56 -
 57
57 -
 58
58 -
 59
59 -
 60
60 -
 61
61 -
 62
62 -
 63
63 -
 64
64 -
 65
65 -
 66
66 -
 67
67 -
 68
68 -
 69
69 -
 70
70 -
 71
71 -
 72
72 -
 73
73 -
 74
74 -
 75
75 -
76
-
77
-
78
-
79
-
80
-
81
-
82
-
83
-
84
-
85
-
86
-
87
-
88
-
89
-
90
-
91
-
92
-
93
-
94
-
95
-
96
-
97
-
98
-
99
-
100
-
101
-
102
-
103
-
104
-
105
-
106
-
107
-
108
-
109
-
110
-
111
-
112
 |
 |

2006 Form10-K 45
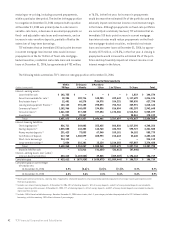
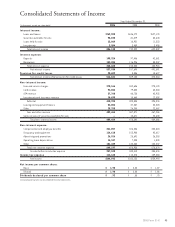
Consolidated Statements of Income
Year Ended December 31,
(In thousands, except per-share data) 2006 2005 2004
Interest income:
Loans and leases $769,590 $636,172 $527,178
Securities available for sale 98,035 81,479 80,643
Loans held for sale 15,009 10,921 11,533
Investments 3,504 3,450 3,455
Total interest income 886,138 732,022 622,809
Interest expense:
Deposits 195,324 97,406 42,581
Borrowings 153,284 116,926 88,337
Total interest expense 348,608 214,332 130,918
Net interest income 537,530 517,690 491,891
Provision for credit losses 20,689 8,586 18,627
Net interest income after provision for credit losses 516,841 509,104 473,264
Non-interest income:
Fees and service charges 270,166 262,636 275,120
Card revenue 92,084 79,803 63,463
ATM revenue 37,760 40,730 42,935
Investments and insurance revenue 10,695 10,665 12,558
Subtotal 410,705 393,834 394,076
Leasing and equipment finance 53,004 47,387 50,323
Other 25,755 26,350 22,887
Fees and other revenue 489,464 467,571 467,286
Gains on sales of securities available for sale –10,671 22,600
Total non-interest income 489,464 478,242 489,886
Non-interest expense:
Compensation and employee benefits 341,857 326,526 322,824
Occupancy and equipment 114,618 103,900 95,617
Advertising and promotions 26,926 25,691 26,353
Operating lease depreciation 14,347 7,335 1,843
Other 151,449 143,484 132,037
Total non-interest expense 649,197 606,936 578,674
Income before income tax expense 357,108 380,410 384,476
Income tax expense 112,165 115,278 129,483
Net income $244,943 $265,132 $254,993
Net income per common share:
Basic $ 1.90 $ 2.00 $ 1.87
Diluted $ 1.90 $ 2.00 $ 1.86
Dividends declared per common share $ .92 $ .85 $ .75
See accompanying notes to consolidated financial statements.