Sharp 2013 Annual Report Download - page 9
Download and view the complete annual report
Please find page 9 of the 2013 Sharp annual report below. You can navigate through the pages in the report by either clicking on the pages listed below, or by using the keyword search tool below to find specific information within the annual report.-
 1
1 -
 2
2 -
 3
3 -
 4
4 -
 5
5 -
 6
6 -
 7
7 -
 8
8 -
 9
9 -
 10
10 -
 11
11 -
 12
12 -
 13
13 -
 14
14 -
 15
15 -
 16
16 -
 17
17 -
 18
18 -
 19
19 -
 20
20 -
21
-
22
-
23
-
24
-
25
-
26
-
27
-
28
-
29
-
30
-
31
-
32
-
33
-
34
-
35
-
36
-
37
-
38
-
39
-
40
-
41
-
42
-
43
-
44
-
45
-
46
-
47
-
48
-
49
-
50
-
51
-
52
-
53
-
54
-
55
-
56
-
57
-
58
-
59
-
60
-
61
-
62
-
63
-
64
-
65
-
66
-
67
-
68
-
69
-
70
-
71
-
72
-
73
 |
 |

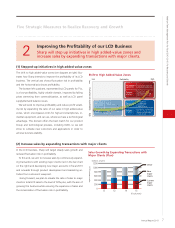
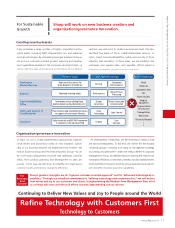
Shift to High Added-Value Zones
Representative
applications
Direction
of actions
Direction
of actions
Direction
of actions
Representative
applications
Representative
applications •LCDTVs
(volumezone)
•Smartphones(high-end)
•Industrial/carapplications
Expandorderswith
ourhighresolutionand
hightechnologymodels
Fluctuation risk in profitability
Low
Low High
High
Profitability
Contributestodifferentia-
tionofcustomersviaswift
responseatearly-stage
conceptdesign
•Smartphones
(volumezone)
•Ultrabook™,
tabletterminals
Controlvolatilitywith
strategicallianceswith
largeclients
Annual Report 2013 7
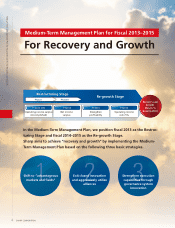
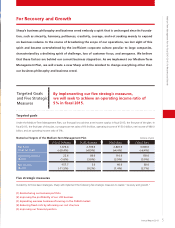
Medium-Term Management Plan for Fiscal 2013-2015: For Recovery and Growth
2Improving the Profitability of our LCD Business
Sharp will step up initiatives in high added-value zones and
increase sales by expanding transactions with major clients.
(1) Stepped-up initiatives in high added-value zones
(2) Increase sales by expanding transactions with major clients
The shift to high added-value zones (see diagram at right) illus-
trates how Sharp intends to improve the profitability of its LCD
business. The vertical axis shows fluctuation risk in profitability
and the horizontal axis shows profitability.
The bottom left quadrant, represented by LCD panels for TVs,
is a low-profitability, highly volatile domain, impacted by falling
prices stemming from commoditization, as well as LCD panel
supply/demand balance issues.
We will work to improve profitability and reduce profit volatil-
ity risk by expanding the ratio of our sales in high added-value
zones, which encompasses LCDs for high-end smartphones, in-
dustrial equipment, and car use, where we have a technological
advantage. This domain offers the best match for our product
lineup and technological prowess, including IGZO, so we will
strive to cultivate new customers and applications in order to
achieve business stability.
In the LCD business, Sharp will target steady sales growth and
reduced fluctuation risk in profitability.
To this end, we aim to increase sales by continuously expand-
ing transactions with existing major clients (red in the bar chart
on the right) and developing new major accounts in fiscal 2013
and onwards through product development and marketing ac-
tivities from customer’s viewpoint.
Going forward, we plan to elevate the ratio of sales to major
clients in total LCD sales to the level of 50% plus, with the aim of
growing this business while ensuring the expansion of sales and
the minimization of fluctuation risk in profitability.
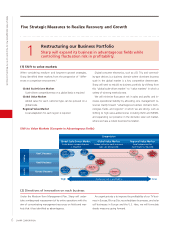
Five Strategic Measures to Realize Recovery and Growth
Sales Growth by Expanding Transactions with
Major Clients (Plan)
0
200
400
600
800
1,000
1,200
(billions of yen)
LCD business sales
(Fiscal years)
12 13 14 15
Current
major
clients
New
major
clients
Other