Sharp 2013 Annual Report Download - page 31
Download and view the complete annual report
Please find page 31 of the 2013 Sharp annual report below. You can navigate through the pages in the report by either clicking on the pages listed below, or by using the keyword search tool below to find specific information within the annual report.-
 1
1 -
2
-
3
-
4
-
5
-
6
-
7
-
8
-
9
-
10
-
11
-
12
-
13
-
14
-
15
-
16
-
17
-
18
-
19
-
20
-
 21
21 -
 22
22 -
 23
23 -
 24
24 -
 25
25 -
 26
26 -
 27
27 -
 28
28 -
 29
29 -
 30
30 -
 31
31 -
 32
32 -
 33
33 -
 34
34 -
 35
35 -
 36
36 -
 37
37 -
 38
38 -
 39
39 -
 40
40 -
 41
41 -
42
-
43
-
44
-
45
-
46
-
47
-
48
-
49
-
50
-
51
-
52
-
53
-
54
-
55
-
56
-
57
-
58
-
59
-
60
-
61
-
62
-
63
-
64
-
65
-
66
-
67
-
68
-
69
-
70
-
71
-
72
-
73
 |
 |

Annual Report 2013 29
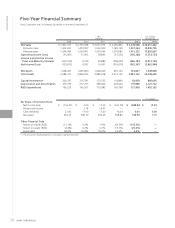
Yen
(millions)
U.S. Dollars
(thousands)
2009 2010 2011 2012 2013 2013
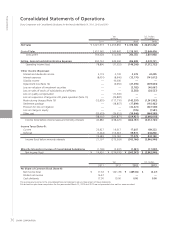
Net Sales ¥ 2,847,227 ¥ 2,755,948 ¥ 3,021,973 ¥ 2,455,850 ¥ 2,478,586 $ 26,651,462
Sales by Product Group
(Sales to Outside Customers)
Audio-Visual and
Communication Equipment 1,367,600 1,332,129 1,426,243 1,060,770 732,017 7,871,150
Health and Environmental
Equipment 225,290 244,090 269,845 292,224 309,613 3,329,172
Information Equipment 306,077 266,920 273,900 277,561 296,787 3,191,258
Consumer/Information Products 1,898,967 1,843,139 1,969,988 1,630,555 1,338,417 14,391,580
LCDs 573,854 508,630 614,373 420,226 650,847 6,998,355
Solar Cells 157,095 208,732 265,492 223,869 259,895 2,794,570
Other Electronic Devices 217,311 195,447 172,120 181,200 229,427 2,466,957
Electronic Components 948,260 912,809 1,051,985 825,295 1,140,169 12,259,882
Total 2,847,227 2,755,948 3,021,973 2,455,850 2,478,586 26,651,462
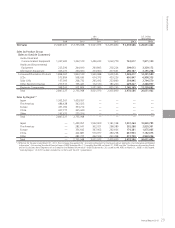
Sales by Region*2
Japan 1,302,261 1,429,057 — — — —
The Americas 488,428 342,923 — — — —
Europe 451,090 393,212 — — — —
China 407,777 365,440 — — — —
Other 197,671 225,316 — — — —
Total 2,847,227 2,755,948 — — — —
Japan — 1,429,057 1,592,909 1,181,168 1,007,264 10,830,795
The Americas — 283,641 302,021 288,380 355,288 3,820,301
Europe — 336,642 367,962 282,606 174,381 1,875,065
China — 422,881 516,977 483,298 667,933 7,182,075
Other — 283,727 242,104 220,398 273,720 2,943,226
Total — 2,755,948 3,021,973 2,455,850 2,478,586 26,651,462
*2 Effective for the year ended March 31, 2011, the Company has applied the “Accounting Standard for Disclosures about Segments of an Enterprise and Related
Information” (Accounting Standards Board of Japan (ASBJ) Statement No. 17, issued by the ASBJ on March 27, 2009) and the “Guidance on Accounting Stand-
ard for Disclosures about Segments of an Enterprise and Related Information” (ASBJ Guidance No. 20, issued by the ASBJ on March 21, 2008). In this regard,
“Sales by Region” of 2010 has been restated to conform with the 2011 presentation.
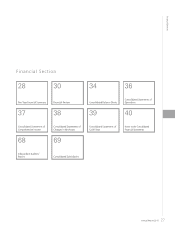
Financial Section