Sharp 2013 Annual Report Download - page 41
Download and view the complete annual report
Please find page 41 of the 2013 Sharp annual report below. You can navigate through the pages in the report by either clicking on the pages listed below, or by using the keyword search tool below to find specific information within the annual report.-
 1
1 -
2
-
3
-
4
-
5
-
6
-
7
-
8
-
9
-
10
-
11
-
12
-
13
-
14
-
15
-
16
-
17
-
18
-
19
-
20
-
21
-
22
-
23
-
24
-
25
-
26
-
27
-
28
-
29
-
30
-
 31
31 -
 32
32 -
 33
33 -
 34
34 -
 35
35 -
 36
36 -
 37
37 -
 38
38 -
 39
39 -
 40
40 -
 41
41 -
 42
42 -
 43
43 -
 44
44 -
 45
45 -
 46
46 -
 47
47 -
 48
48 -
 49
49 -
 50
50 -
 51
51 -
52
-
53
-
54
-
55
-
56
-
57
-
58
-
59
-
60
-
61
-
62
-
63
-
64
-
65
-
66
-
67
-
68
-
69
-
70
-
71
-
72
-
73
 |
 |

Annual Report 2013 39
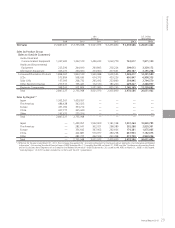
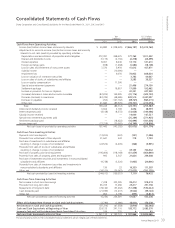
Consolidated Statements of Cash Flows
Sharp Corporation and Consolidated Subsidiaries for the Years Ended March 31, 2011, 2012 and 2013
Financial Section
Yen
(millions)
U.S. Dollars
(thousands)
2011 2012 2013 2013
Cash Flows from Operating Activities:
Income (loss) before income taxes and minority interests ¥ 40,880 ¥ (238,429) ¥ (466,187) $ (5,012,763)
Adjustments to reconcile income (loss) before income taxes and minority
interests to net cash (used in) provided by operating activities —
Depreciation and amortization of properties and intangibles 272,081 248,425 177,765 1,911,452
Interest and dividends income (3,119) (2,730) (2,278) (24,495)
Interest expenses 8,001 8,646 13,170 141,613
Foreign exchange gains (938) (1,268) (1,684) (18,108)
Loss on sales and retirement of noncurrent assets 7,376 5,950 15,612 167,871
Subsidy income — (10,000) — —
Impairment loss — 6,656 78,922 848,624
Loss on valuation of investment securities — — 3,782 40,667
Loss on sales of stocks of subsidiaries and affiliates — — 3,583 38,527
Loss on quality compensation — 11,500 — —
Special extra retirement payments — — 25,496 274,150
Settlement package — 18,857 17,899 192,462
Increase in provision for loss on litigation — — 32,321 347,538
(Increase) decrease in notes and accounts receivable (82,209) 149,905 (41,176) (442,753)
Decrease (increase) in inventories (83,749) (48,686) 228,510 2,457,097
Decrease in payables (762) (147,162) (89,765) (965,215)
Other, net 41,684 (89,976) (19,721) (212,054)
Total 199,245 (88,312) (23,751) (255,387)
Interest and dividends income received 3,664 3,169 2,656 28,559
Interest expenses paid (8,148) (8,572) (13,028) (140,086)
Subsidy income received — — 10,000 107,527
Special extra retirement payments paid — — (25,289) (271,925)
Settlement package paid — (18,622) (16,894) (181,656)
Income taxes paid (27,318) (30,965) (14,769) (158,806)
Net cash (used in) provided by operating activities 167,443 (143,302) (81,075) (871,774)
Cash Flows from Investing Activities:
Payments into time deposits (13,200) (603) (101) (1,086)
Proceeds from withdrawal of time deposits 31,641 443 718 7,720
Purchase of investments in subsidiaries and affiliates
resulting in change in scope of consolidation (24,524) (4,405) (366) (3,935)
Proceeds from sales of stocks of subsidiaries and affiliates
resulting in change in scope of consolidation — — 65,143 700,462
Purchase of property, plant and equipment (195,404) (118,168) (61,459) (660,849)
Proceeds from sales of property, plant and equipment 992 2,547 21,826 234,688
Purchase of investment securities and investments in nonconsolidated
subsidiaries and affiliates (9,738) (3,326) (1,935) (20,806)
Proceeds from sales of investment securities and investments in
nonconsolidated subsidiaries and affiliates 130 22 10,359 111,387
Other, net (34,510) (36,067) (27,075) (291,129)
Net cash provided by (used in) investing activities (244,613) (159,557) 7,110 76,452
Cash Flows from Financing Activities:
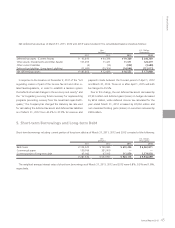
Net increase in short-term borrowings 7,328 305,595 85,413 918,419
Proceeds from long-term debt 85,725 13,286 23,417 251,796
Repayments of long-term debt (78,162) (53,462) (51,338) (552,022)
Cash dividends paid (21,999) (13,237) (5,500) (59,140)
Other, net 854 4,199 (355) (3,817)
Net cash provided by (used in) financing activities (6,254) 256,381 51,637 555,236
Effect of Exchange Rate Change on Cash and Cash Equivalents (3,790) (1,080) 16,418 176,538
Net Decrease in Cash and Cash Equivalents (87,214) (47,558) (5,910) (63,548)
Cash and Cash Equivalents at Beginning of Year 328,125 241,110 193,772 2,083,570
Increase in Cash and Cash Equivalents from Newly Consolidated Subsidiary
199 220 4 43
Cash and Cash Equivalents at End of Year ¥ 241,110 ¥ 193,772 ¥ 187,866 $ 2,020,065
The accompanying notes to the consolidated financial statements are an integral part of these statements.