Sharp 2013 Annual Report Download - page 51
Download and view the complete annual report
Please find page 51 of the 2013 Sharp annual report below. You can navigate through the pages in the report by either clicking on the pages listed below, or by using the keyword search tool below to find specific information within the annual report.-
 1
1 -
2
-
3
-
4
-
5
-
6
-
7
-
8
-
9
-
10
-
11
-
12
-
13
-
14
-
15
-
16
-
17
-
18
-
19
-
20
-
21
-
22
-
23
-
24
-
25
-
26
-
27
-
28
-
29
-
30
-
31
-
32
-
33
-
34
-
35
-
36
-
37
-
38
-
39
-
40
-
 41
41 -
 42
42 -
 43
43 -
 44
44 -
 45
45 -
 46
46 -
 47
47 -
 48
48 -
 49
49 -
 50
50 -
 51
51 -
 52
52 -
 53
53 -
 54
54 -
 55
55 -
 56
56 -
 57
57 -
 58
58 -
 59
59 -
 60
60 -
 61
61 -
62
-
63
-
64
-
65
-
66
-
67
-
68
-
69
-
70
-
71
-
72
-
73
 |
 |
Annual Report 2013 49
Financial Section
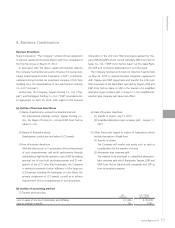
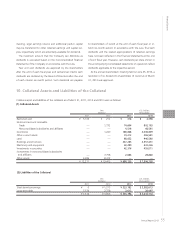
For other securities and investments in capital, The Com-
pany regularly monitors prices and the issuer’s financial
position, and continually reviews the possession by taking
these indices as well as the relationship with issuers into
consideration.
[3] Management of liquidity risk in financing activities
The Treasury Department manages liquidity risk by making
and updating financial plans based on reports from each
section, and maintains ready liquidity.
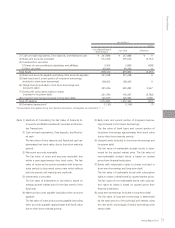
(4) Supplementary explanation of fair value of financial
instruments
The fair value of financial instruments is based on the quoted
market price in the active market, but in case a market price is
not available, reasonably estimated prices are included in fair
value. As variable factors are incorporated in the determina-
tion of this reasonably estimated price, it may vary depend-
ing on different assumptions. The contract amount related to
derivative transactions has nothing to do with the market risk
related to the derivative transactions.
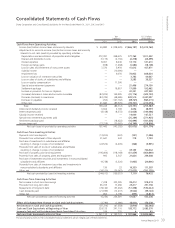
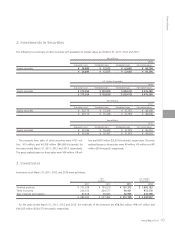
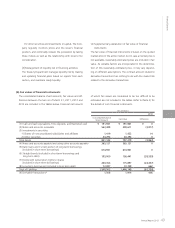
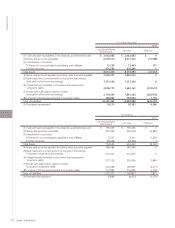
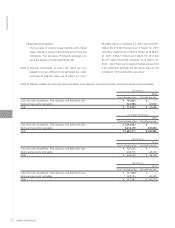
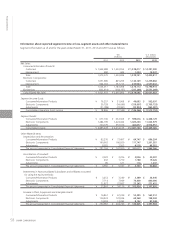
(b) Fair values of financial instruments
The consolidated balance sheet amounts, fair values and dif-
ferences between the two as of March 31, 2011, 2012 and
2013 are included in the tables below. Financial instruments
of which fair values are considered to be too difficult to be
estimated are not included in the tables. Refer to (Note 2) for
the details of such financial instruments.
Yen (millions)
2013
Consolidated Balance
Sheet Amount Fair Value Difference
(1) Cash and cash equivalents, Time deposits, and Restricted cash ¥ 191,941 ¥ 191,941 ¥ 0
(2) Notes and accounts receivable 563,488 559,611 (3,877)
(3) Investments in securities
1) Shares of nonconsolidated subsidiaries and affiliates 1,419 1,433 14
2) Other securities 44,294 44,294 0
Total Assets 801,142 797,279 (3,863)
(4) Notes and accounts payable (excluding other accounts payable) 365,121 365,121 0
(5) Bank loans and Current portion of long-term borrowings
(included in short-term borrowings) 674,941 674,941 0
(6) Straight bonds (included in short-term borrowings and
long-term debt) 195,000 156,441 (38,559)
(7) Bonds with subscription rights to shares
(included in short-term borrowings) 200,354 175,897 (24,457)
(8) Long-term borrowings (included in long-term debt) 73,087 73,749 662
Total of Liabilities 1,508,503 1,446,149 (62,354)
(9) Derivative transactions* 1,508 1,914 406