Sharp 2013 Annual Report Download - page 11
Download and view the complete annual report
Please find page 11 of the 2013 Sharp annual report below. You can navigate through the pages in the report by either clicking on the pages listed below, or by using the keyword search tool below to find specific information within the annual report.-
 1
1 -
 2
2 -
 3
3 -
 4
4 -
 5
5 -
 6
6 -
 7
7 -
 8
8 -
 9
9 -
 10
10 -
 11
11 -
 12
12 -
 13
13 -
 14
14 -
 15
15 -
 16
16 -
 17
17 -
 18
18 -
 19
19 -
 20
20 -
 21
21 -
 22
22 -
23
-
24
-
25
-
26
-
27
-
28
-
29
-
30
-
31
-
32
-
33
-
34
-
35
-
36
-
37
-
38
-
39
-
40
-
41
-
42
-
43
-
44
-
45
-
46
-
47
-
48
-
49
-
50
-
51
-
52
-
53
-
54
-
55
-
56
-
57
-
58
-
59
-
60
-
61
-
62
-
63
-
64
-
65
-
66
-
67
-
68
-
69
-
70
-
71
-
72
-
73
 |
 |
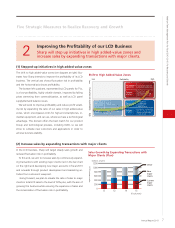
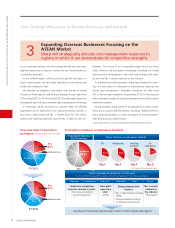
• No. 1 sales channel coverage
• Unique marketing utilizing
%
%
%
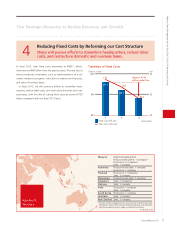
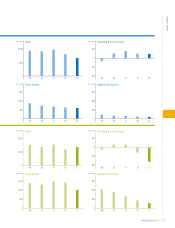
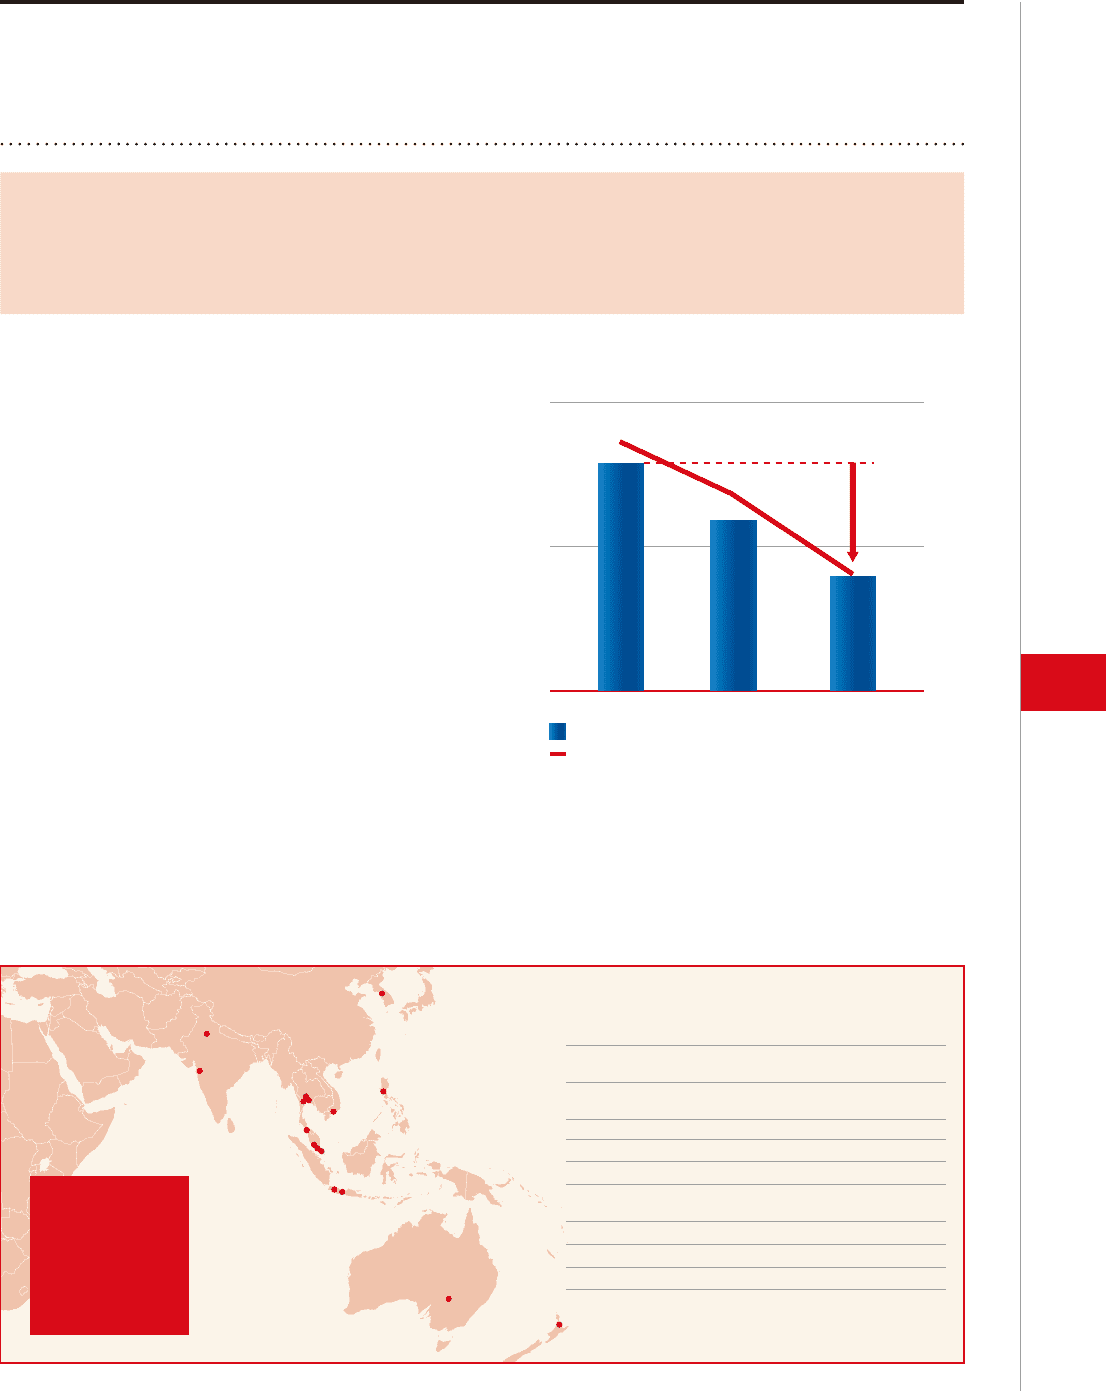
Transition of Fixed Costs
11 12 13
(billions of yen) (%)
(Fiscal years)
Approx. ¥150
billion reduction
37.3
33.7
28.1
Fixed costs (left axis)
Sales ratio (right axis)
600
800
1,000
20
30
40
915.8
836.1
Malaysia Regional headquarters/
Product development: 1 company*
Production: 2 companies
Sales: 1 company
Indonesia Production and sales: 1 company
Production: 1 company
Thailand Production: 2 companies
Sales: 1 company
Philippines Production and sales: 1 company
Singapore Sales: 2 companies
Vietnam Sales: 1 company
India Production: 1 company
Sales: 1 company
South Korea Production: 1 company
Australia Sales: 1 company
New Zealand Sales: 1 company
* Activities include strategy, personnel, sales planning, AV product planning/
development, design center, lifestyle marketing, branding, sales promotion,
quality/service planning, parts supply, and materials purchasing.
Asia-Pacific
Structure
(As of June 2013)
Annual Report 2013 9
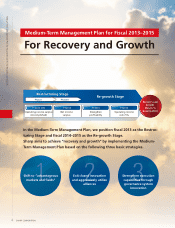
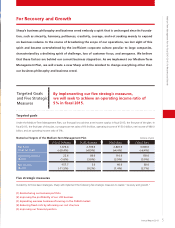
Medium-Term Management Plan for Fiscal 2013-2015: For Recovery and Growth
4Reducing Fixed Costs by Reforming our Cost Structure
Sharp will pursue efforts to streamline headquarters, reduce labor
costs, and restructure domestic and overseas bases.
In fiscal 2012, total fixed costs amounted to ¥836.1 billion,
down around ¥80 billion from the previous year. This was due to
various measures undertaken, such as implementation of a vol-
untary retirement program, reductions in salaries and bonuses,
and sales of business bases.
In fiscal 2013, we will continue efforts to streamline head-
quarters, reduce labor costs, and restructure domestic and over-
seas bases, with the aim of cutting fixed costs by around ¥150
billion compared with the fiscal 2011 level.
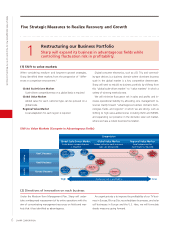
Five Strategic Measures to Realize Recovery and Growth