Sharp 2013 Annual Report Download - page 37
Download and view the complete annual report
Please find page 37 of the 2013 Sharp annual report below. You can navigate through the pages in the report by either clicking on the pages listed below, or by using the keyword search tool below to find specific information within the annual report.-
 1
1 -
2
-
3
-
4
-
5
-
6
-
7
-
8
-
9
-
10
-
11
-
12
-
13
-
14
-
15
-
16
-
17
-
18
-
19
-
20
-
21
-
22
-
23
-
24
-
25
-
26
-
 27
27 -
 28
28 -
 29
29 -
 30
30 -
 31
31 -
 32
32 -
 33
33 -
 34
34 -
 35
35 -
 36
36 -
 37
37 -
 38
38 -
 39
39 -
 40
40 -
 41
41 -
 42
42 -
 43
43 -
 44
44 -
 45
45 -
 46
46 -
 47
47 -
48
-
49
-
50
-
51
-
52
-
53
-
54
-
55
-
56
-
57
-
58
-
59
-
60
-
61
-
62
-
63
-
64
-
65
-
66
-
67
-
68
-
69
-
70
-
71
-
72
-
73
 |
 |

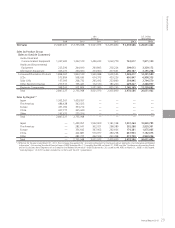
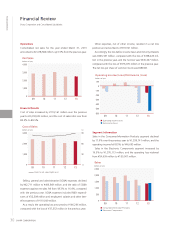
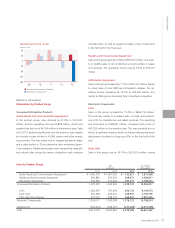
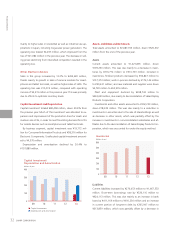
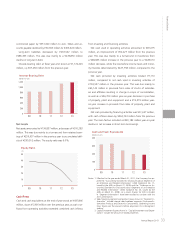
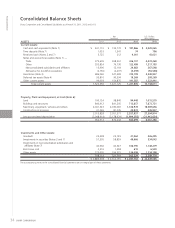
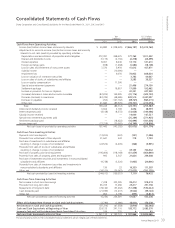
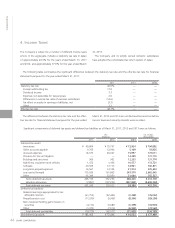
Annual Report 2013 35
Financial Section
Yen
(millions)
U.S. Dollars
(thousands)
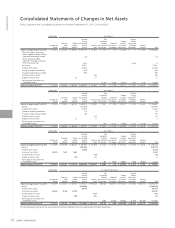
LIABILITIES AND NET ASSETS 2011 2012 2013 2013
Current Liabilities:
Short-term borrowings, including current portion of
long-term debt (Notes 5 and 7) ¥ 287,330 ¥ 597,997 ¥ 924,113 $ 9,936,699
Notes and accounts payable (Note 7) —
Trade 524,641 384,322 341,351 3,670,441
Construction and other 71,356 47,804 40,616 436,731
Nonconsolidated subsidiaries and affiliates 6,084 4,447 23,657 254,377
Accrued expenses 217,339 195,506 240,394 2,584,882
Income taxes (Note 4) 12,471 5,963 6,206 66,731
Other current liabilities (Note 4) 126,692 155,041 91,196 980,602
Total current liabilities 1,245,913 1,391,080 1,667,533 17,930,463
Long-term Liabilities:
Long-term debt (Notes 5 and 7) 559,920 529,160 250,310 2,691,505
Allowance for severance and pension benefits (Note 12) 4,618 6,000 6,501 69,903
Deferred tax liabilities (Note 4) 11,600 29,304 14,044 151,011
Other long-term liabilities 14,982 13,471 14,538 156,323
591,120 577,935 285,393 3,068,742
Contingent Liabilities (Note 11)
Net Assets (Note 9):
Common stock:
Authorized — 2,500,000 thousand shares
Issued — 1,110,699 thousand shares in 2011 and 2012,
and 1,176,623 thousand shares in 2013 204,676 204,676 212,337 2,283,193
Capital surplus 268,530 268,528 276,179 2,969,667
Retained earnings (accumulated deficits) 648,935 259,937 (290,912) (3,128,086)
Less cost of treasury stock:
10,353 thousand shares, 10,375 thousand shares and
10,399 thousand shares in 2011, 2012 and 2013 (13,863) (13,876) (13,872) (149,161)
Net unrealized holding gains (losses) on securities 5,915 5,610 6,062 65,183
Deferred gains (losses) on hedges (1,028) (5,749) (25) (269)
Foreign currency translation adjustments (85,317) (90,305) (61,467) (660,936)
Pension liability adjustment of foreign subsidiaries (1,815) (2,927) (3,631) (39,043)
Minority interests 22,612 19,226 10,166 109,312
Total net assets 1,048,645 645,120 134,837 1,449,860
¥ 2,885,678 ¥ 2,614,135 ¥ 2,087,763 $ 22,449,065