Sharp 2013 Annual Report Download - page 52
Download and view the complete annual report
Please find page 52 of the 2013 Sharp annual report below. You can navigate through the pages in the report by either clicking on the pages listed below, or by using the keyword search tool below to find specific information within the annual report.-
 1
1 -
2
-
3
-
4
-
5
-
6
-
7
-
8
-
9
-
10
-
11
-
12
-
13
-
14
-
15
-
16
-
17
-
18
-
19
-
20
-
21
-
22
-
23
-
24
-
25
-
26
-
27
-
28
-
29
-
30
-
31
-
32
-
33
-
34
-
35
-
36
-
37
-
38
-
39
-
40
-
41
-
 42
42 -
 43
43 -
 44
44 -
 45
45 -
 46
46 -
 47
47 -
 48
48 -
 49
49 -
 50
50 -
 51
51 -
 52
52 -
 53
53 -
 54
54 -
 55
55 -
 56
56 -
 57
57 -
 58
58 -
 59
59 -
 60
60 -
 61
61 -
 62
62 -
63
-
64
-
65
-
66
-
67
-
68
-
69
-
70
-
71
-
72
-
73
 |
 |

50 SHARP CORPORATION
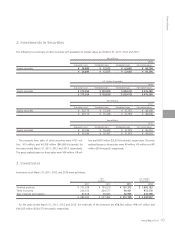
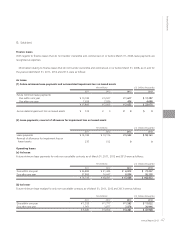
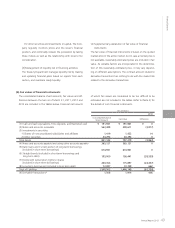
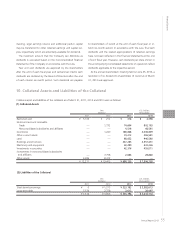
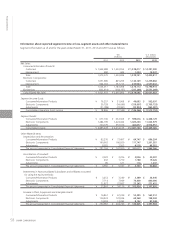
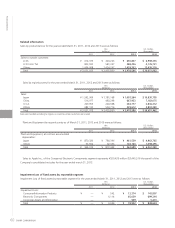
U.S. Dollars (thousands)
2013
Consolidated Balance
Sheet Amount Fair Value Difference
(1) Cash and cash equivalents, Time deposits, and Restricted cash $ 2,063,882 $ 2,063,882 $ 0
(2) Notes and accounts receivable 6,059,010 6,017,322 (41,688)
(3) Investments in securities
1) Shares of nonconsolidated subsidiaries and affiliates 15,258 15,409 151
2) Other securities 476,280 476,280 0
Total Assets 8,614,430 8,572,893 (41,537)
(4) Notes and accounts payable (excluding other accounts payable) 3,926,032 3,926,032 0
(5) Bank loans and Current portion of long-term borrowings
(included in short-term borrowings) 7,257,430 7,257,430 0
(6) Straight bonds (included in short-term borrowings and
long-term debt) 2,096,774 1,682,161 (414,613)
(7) Bonds with subscription rights to shares
(included in short-term borrowings) 2,154,344 1,891,366 (262,978)
(8) Long-term borrowings (included in long-term debt) 785,882 793,000 7,118
Total of Liabilities 16,220,462 15,549,989 (670,473)
(9) Derivative transactions* 16,215 20,581 4,366
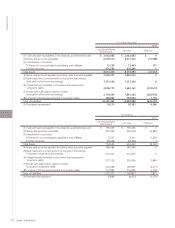
Yen (millions)
2012
Consolidated Balance
Sheet Amount Fair Value Difference
(1) Cash and cash equivalents, Time deposits, and Restricted cash ¥ 195,325 ¥ 195,325 ¥ 0
(2) Notes and accounts receivable 457,455 450,568 (6,887)
(3) Investments in securities
1) Shares of nonconsolidated subsidiaries and affiliates 3,357 2,101 (1,256)
2) Other securities 48,408 48,408 0
Total Assets 704,545 696,402 (8,143)
(4) Notes and accounts payable (excluding other accounts payable) 389,484 389,484 0
(5) Bank loans and Current portion of long-term borrowings
(included in short-term borrowings) 212,321 212,321 0
(6) Straight bonds (included in short-term borrowings and
long-term debt) 217,126 220,966 3,840
(7) Bonds with subscription rights to shares
(included in long-term debt) 201,068 196,997 (4,071)
(8) Long-term borrowings (included in long-term debt) 112,952 115,055 2,103
Total of Liabilities 1,132,951 1,134,823 1,872
(9) Derivative transactions* (6,881) (8,051) (1,170)
Financial Section