Sharp 2013 Annual Report Download - page 17
Download and view the complete annual report
Please find page 17 of the 2013 Sharp annual report below. You can navigate through the pages in the report by either clicking on the pages listed below, or by using the keyword search tool below to find specific information within the annual report.-
 1
1 -
2
-
3
-
4
-
5
-
6
-
 7
7 -
 8
8 -
 9
9 -
 10
10 -
 11
11 -
 12
12 -
 13
13 -
 14
14 -
 15
15 -
 16
16 -
 17
17 -
 18
18 -
 19
19 -
 20
20 -
 21
21 -
 22
22 -
 23
23 -
 24
24 -
 25
25 -
 26
26 -
 27
27 -
28
-
29
-
30
-
31
-
32
-
33
-
34
-
35
-
36
-
37
-
38
-
39
-
40
-
41
-
42
-
43
-
44
-
45
-
46
-
47
-
48
-
49
-
50
-
51
-
52
-
53
-
54
-
55
-
56
-
57
-
58
-
59
-
60
-
61
-
62
-
63
-
64
-
65
-
66
-
67
-
68
-
69
-
70
-
71
-
72
-
73
 |
 |
Annual Report 2013 15
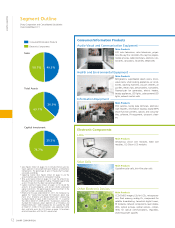
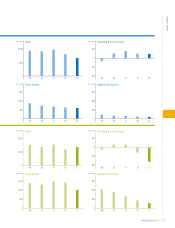
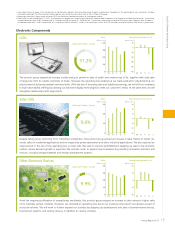
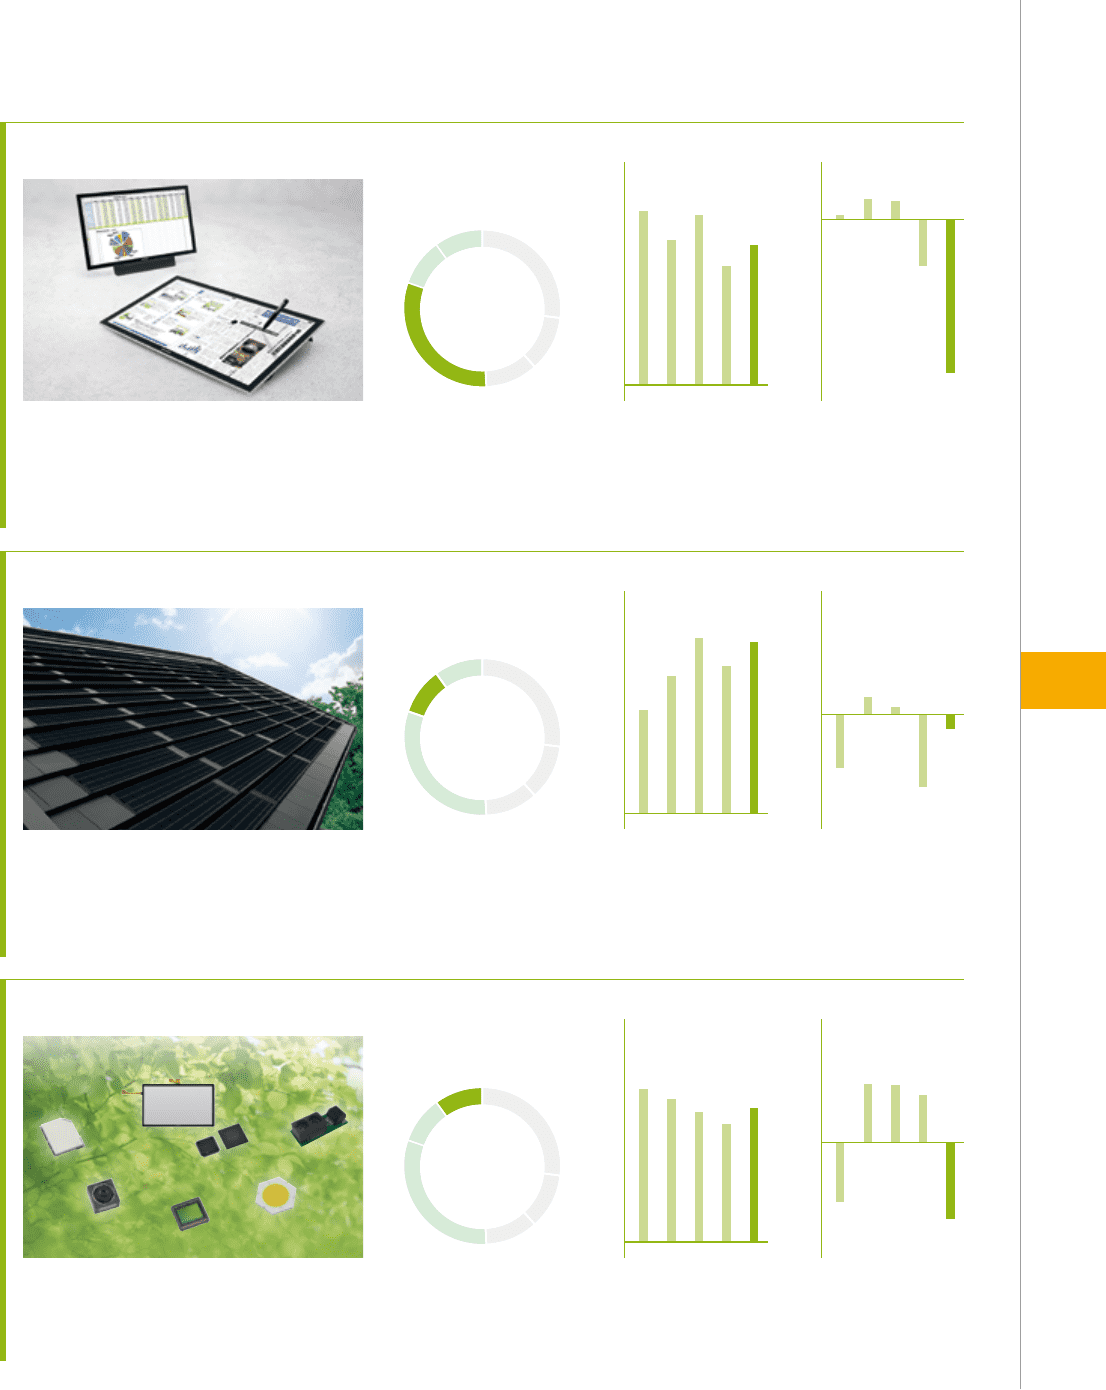
Electronic Components
売上高構成比 営業利益(損失)
(十億円)
売上高
(十億円)
0
300
600
900
1,200
09 10 11 12 13
-150
-120
-30
-60
-90
0
30
09 10 11 12 13
(billions of yen) (billions of yen)
Sales Operating Income (Loss)
31.2%
31.2%
Sales by Product Group
LCDs
This product group enjoyed an increase in sales owing to growth in sales of small- and medium-size LCDs, together with solid sales
of large-size LCDs to outside customers of Sharp. However, the operating loss widened as we made production adjustments at our
plants aimed at achieving optimal inventory levels. With the aim of boosting sales and stabilizing earnings, we will shift our emphasis
to high-value-added offerings by utilizing our distinctive display technologies to meet our customers’ needs. At the same time, we will
strengthen relationships with large clients.
売上高構成比 営業利益(損失)
(十億円)
売上高
(十億円)
0
100
200
300
09 10 11 12 13
-30
-20
-10
10
0
30
20
09 10 11 12 13
Operating Income (Loss)Sales
(billions of yen) (billions of yen)
9.6%
9.6%
Sales by Product Group
Solar Cells
Despite falling prices stemming from intensified competition, this product group posted an increase in sales thanks to higher do-
mestic sales on residential applications and on mega-solar power generation and other industrial applications. We also reported an
improvement in the size of the operating loss on solar cells. We seek to improve profitability by stepping up sales in the domestic
market, where demand growth is expected. We will also work to expand new businesses by providing innovative solutions and
services, including storage batteries and energy management systems.
Other Electronic Devices
売上高構成比 営業利益(損失)
(十億円)
売上高
(十億円)
0
100
200
300
400
09 10 11 12 13
-20
-10
10
0
20
09 10 11 12 13
Sales Operating Income (Loss)
(billions of yen) (billions of yen)
9.9%
9.9%
Sales by Product Group
Amid the ongoing proliferation of smartphones worldwide, this product group enjoyed an increase in sales owing to higher sales
of its mainstay camera modules. However, we recorded an operating loss due to an inventory write-down recognized as part of
structural reforms. We will work to further expand our business by stepping up development and sales of power-related devices,
touchscreen systems, and sensing devices, in addition to camera modules.
• Sales gures shown on pages 14-15 include internal sales between segments (Consumer/Information Products and Electronic Components). The percentage of sales in pie charts has been
calculated accordingly. The Other Electronic Devices group’s sales do not include internal sales to the LCD/Solar Cell groups.
• Operating income (loss) gures shown on page 14-15 are the amounts before adjustments of intersegment trading.
• Effective for the year ended March 31, 2011, the Company has applied the “Accounting Standard for Disclosures about Segments of an Enterprise and Related Information” (Accounting
Standards Board of Japan (ASBJ) Statement No.17, Issued by the ASBJ on March 27, 2009) and the “Guidance on Accounting Standard for Disclosures about Segments of an Enterprise
and Related Information” (ASBJ Guidance No. 20, issued by the ASBJ on March 21, 2008). In this connection, results for 2010 have been restated to conform with the 2011 presentation.
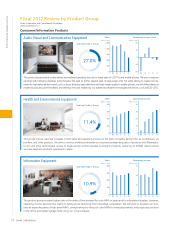
Fiscal 2012 Review by Product Group
売上高構成比 営業利益
(十億円)
売上高
(十億円)
11.4%
11.4%
売上高構成比 営業利益(損失)
(十億円)
売上高
(十億円)
27.0%
27.0%
売上高構成比 営業利益
(十億円)
売上高
(十億円)
10.9%
10.9%