Sharp 2013 Annual Report Download - page 65
Download and view the complete annual report
Please find page 65 of the 2013 Sharp annual report below. You can navigate through the pages in the report by either clicking on the pages listed below, or by using the keyword search tool below to find specific information within the annual report.-
 1
1 -
2
-
3
-
4
-
5
-
6
-
7
-
8
-
9
-
10
-
11
-
12
-
13
-
14
-
15
-
16
-
17
-
18
-
19
-
20
-
21
-
22
-
23
-
24
-
25
-
26
-
27
-
28
-
29
-
30
-
31
-
32
-
33
-
34
-
35
-
36
-
37
-
38
-
39
-
40
-
41
-
42
-
43
-
44
-
45
-
46
-
47
-
48
-
49
-
50
-
51
-
52
-
53
-
54
-
 55
55 -
 56
56 -
 57
57 -
 58
58 -
 59
59 -
 60
60 -
 61
61 -
 62
62 -
 63
63 -
 64
64 -
 65
65 -
 66
66 -
 67
67 -
 68
68 -
 69
69 -
 70
70 -
 71
71 -
 72
72 -
 73
73
 |
 |
Annual Report 2013 63
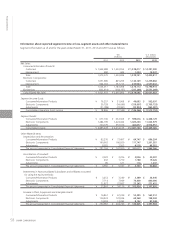
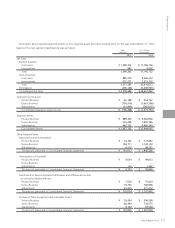
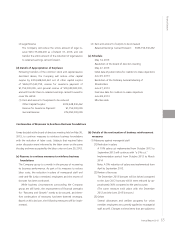
Information about reported segment income or loss, segment assets and other material items for the year ended March 31, 2013,
based on the new segment classifications was as follows:
Financial Section
Yen
(millions)
U.S. Dollars
(thousands)
2013 2013
Net Sales:
Product Business:
Customers ¥ 1,598,312 $ 17,186,150
Intersegment 893 9,602
Total 1,599,205 17,195,752
Device Business:
Customers 880,274 9,465,312
Intersegment 237,271 2,551,301
Total 1,117,545 12,016,613
Eliminations (238,164) (2,560,903)
Consolidated Net Sales ¥ 2,478,586 $ 26,651,462
Segment Income (Loss):
Product Business ¥ 42,198 $ 453,742
Device Business (154,510) (1,661,398)
Adjustments (33,954) (365,097)
Consolidated Operating (Loss) Income ¥ (146,266) $ (1,572,753)
Segment Assets:
Product Business ¥ 889,353 $ 9,562,936
Device Business 735,238 7,905,785
Adjustments 463,172 4,980,344
Consolidated Assets ¥ 2,087,763 $ 22,449,065
Other Material Items
Depreciation and Amortization:
Product Business ¥ 72,323 $ 777,667
Device Business 104,171 1,120,118
Adjustments 4,518 48,581
The amount presented in Consolidated Financial Statements ¥ 181,012 $ 1,946,366
Amortization of Goodwill:
Product Business ¥ 4,614 $ 49,613
Device Business — —
Adjustments 116 1,247
The amount presented in Consolidated Financial Statements ¥ 4,730 $ 50,860
Investments in Nonconsolidated Subsidiaries and Affiliates accounted
for using the equity methods:
Product Business ¥ 7,034 $ 75,634
Device Business 70,755 760,806
Adjustments 25,245 271,452
The amount presented in Consolidated Financial Statements ¥ 103,034 $ 1,107,892
Increase in Plant, Equipment and Intangible Assets:
Product Business ¥ 55,454 $ 596,280
Device Business 66,409 714,075
Adjustments 8,142 87,548
The amount presented in Consolidated Financial Statements ¥ 130,005 $ 1,397,903