Sharp 2013 Annual Report Download - page 15
Download and view the complete annual report
Please find page 15 of the 2013 Sharp annual report below. You can navigate through the pages in the report by either clicking on the pages listed below, or by using the keyword search tool below to find specific information within the annual report.-
 1
1 -
2
-
3
-
4
-
 5
5 -
 6
6 -
 7
7 -
 8
8 -
 9
9 -
 10
10 -
 11
11 -
 12
12 -
 13
13 -
 14
14 -
 15
15 -
 16
16 -
 17
17 -
 18
18 -
 19
19 -
 20
20 -
 21
21 -
 22
22 -
 23
23 -
 24
24 -
 25
25 -
26
-
27
-
28
-
29
-
30
-
31
-
32
-
33
-
34
-
35
-
36
-
37
-
38
-
39
-
40
-
41
-
42
-
43
-
44
-
45
-
46
-
47
-
48
-
49
-
50
-
51
-
52
-
53
-
54
-
55
-
56
-
57
-
58
-
59
-
60
-
61
-
62
-
63
-
64
-
65
-
66
-
67
-
68
-
69
-
70
-
71
-
72
-
73
 |
 |

Annual Report 2013 13
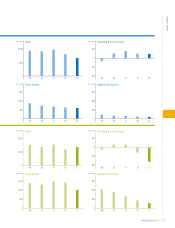
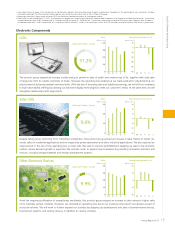
Sales
(billions of yen) (billions of yen)
(billions of yen) (billions of yen)
Total Assets
Oprating Income (Loss)
Capital Investment
09
0
1,000
2,000
10 11 12 13 09
-200
-100
0
100
10 11 12 13
09
0
1,000
500
1,500
10 11 12 13 09
0
100
200
300
10 11 12 13
(billions of yen) (billions of yen)
(billions of yen) (billions of yen)
Sales
Total Assets
Oprating Income (Loss)
Capital Investment
09 10 11 12 13 09 10 11 12 13
09 10 11 12 13 09 10 11 12 13
0
100
200
300
-200
-100
0
100
0
1,000
500
1,500
0
1,000
2,000
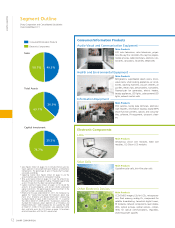
Segment Outline
エレクトロニクス機器
電子部品
売上高
総資産
設備投資
49.3%50.7%
36.9%
63.1%
25.3%
74.7%
• Sales gures shown on pages 12-13 include internal sales be
• Operating income (loss) gures shown on page 13 are the
• Total assets gures shown on pages 12-13 are the amounts be
• Capital investment gures shown on pages 12-13 include the
• Effective for the year ended March 31, 2011, the Company has