Sharp 2013 Annual Report Download - page 39
Download and view the complete annual report
Please find page 39 of the 2013 Sharp annual report below. You can navigate through the pages in the report by either clicking on the pages listed below, or by using the keyword search tool below to find specific information within the annual report.-
 1
1 -
2
-
3
-
4
-
5
-
6
-
7
-
8
-
9
-
10
-
11
-
12
-
13
-
14
-
15
-
16
-
17
-
18
-
19
-
20
-
21
-
22
-
23
-
24
-
25
-
26
-
27
-
28
-
 29
29 -
 30
30 -
 31
31 -
 32
32 -
 33
33 -
 34
34 -
 35
35 -
 36
36 -
 37
37 -
 38
38 -
 39
39 -
 40
40 -
 41
41 -
 42
42 -
 43
43 -
 44
44 -
 45
45 -
 46
46 -
 47
47 -
 48
48 -
 49
49 -
50
-
51
-
52
-
53
-
54
-
55
-
56
-
57
-
58
-
59
-
60
-
61
-
62
-
63
-
64
-
65
-
66
-
67
-
68
-
69
-
70
-
71
-
72
-
73
 |
 |

Annual Report 2013 37
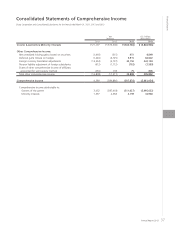
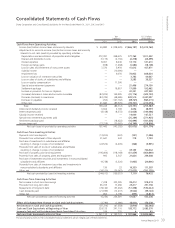
Consolidated Statements of Comprehensive Income
Sharp Corporation and Consolidated Subsidiaries for the Years Ended March 31, 2011, 2012 and 2013
Yen
(millions)
U.S. Dollars
(thousands)
2011 2012 2013 2013
Income (Loss) before Minority Interests ¥ 21,197 ¥ (373,569) ¥ (543,766) $ (5,846,946)
Other Comprehensive Income:
Net unrealized holding gains (losses) on securities (1,460) (515) 451 4,849
Deferred gains (losses) on hedges (1,246) (4,725) 5,915 63,602
Foreign currency translation adjustments (13,254) (5,137) 30,150 324,194
Pension liability adjustment of foreign subsidiaries (612) (1,112) (703) (7,559)
Share of other comprehensive income of affiliates
accounted for using equity method (236) 178 75 806
Total other comprehensive income (16,808) (11,311) 35,888 385,892
Comprehensive Income 4,389 (384,880) (507,878) (5,461,054)
Comprehensive income attributable to:
Owners of the parent 3,052 (387,418) (511,037) (5,495,022)
Minority interests 1,337 2,538 3,159 33,968
Financial Section