Sharp 2013 Annual Report Download - page 62
Download and view the complete annual report
Please find page 62 of the 2013 Sharp annual report below. You can navigate through the pages in the report by either clicking on the pages listed below, or by using the keyword search tool below to find specific information within the annual report.-
 1
1 -
2
-
3
-
4
-
5
-
6
-
7
-
8
-
9
-
10
-
11
-
12
-
13
-
14
-
15
-
16
-
17
-
18
-
19
-
20
-
21
-
22
-
23
-
24
-
25
-
26
-
27
-
28
-
29
-
30
-
31
-
32
-
33
-
34
-
35
-
36
-
37
-
38
-
39
-
40
-
41
-
42
-
43
-
44
-
45
-
46
-
47
-
48
-
49
-
50
-
51
-
 52
52 -
 53
53 -
 54
54 -
 55
55 -
 56
56 -
 57
57 -
 58
58 -
 59
59 -
 60
60 -
 61
61 -
 62
62 -
 63
63 -
 64
64 -
 65
65 -
 66
66 -
 67
67 -
 68
68 -
 69
69 -
 70
70 -
 71
71 -
 72
72 -
73
 |
 |

60 SHARP CORPORATION
ment of thin-lm solar cells in the Katsuragi Plant etc. to recover
Related information
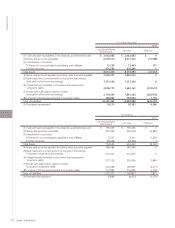
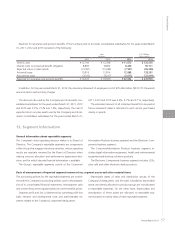
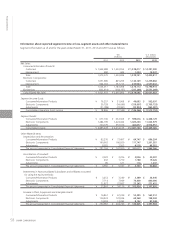
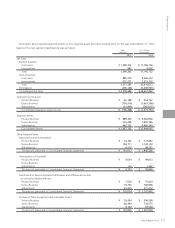
Sales by product/service for the years ended March 31, 2011, 2012 and 2013 were as follows:
Yen
(millions)
U.S. Dollars
(thousands)
2011 2012 2013 2013
Sales to outside customers:
LCDs ¥ 614,373 ¥ 420,226 ¥ 650,847 $ 6,998,355
LCD Color TVs 803,592 581,357 388,436 4,176,731
Others 1,604,008 1,454,267 1,439,303 15,476,376
Total ¥ 3,021,973 ¥ 2,455,850 ¥ 2,478,586 $ 26,651,462
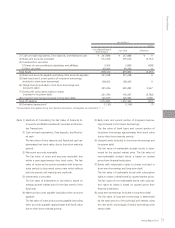
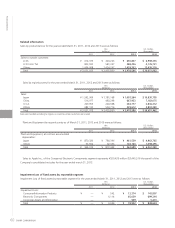
Sales by region/country for the years ended March 31, 2011, 2012 and 2013 were as follows:
Yen
(millions)
U.S. Dollars
(thousands)
2011 2012 2013 2013
Sales:
Japan ¥ 1,592,909 ¥ 1,181,168 ¥ 1,007,264 $ 10,830,795
China 516,977 483,298 667,933 7,182,075
U.S.A. 229,955 240,668 263,777 2,836,312
Others 682,132 550,716 539,612 5,802,280
Total ¥ 3,021,973 ¥ 2,455,850 ¥ 2,478,586 $ 26,651,462
Sales are classified according to regions or countries where customers are located.
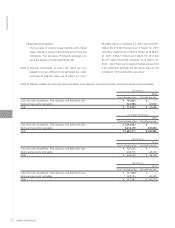
Plant and Equipment by region/country as of March 31, 2011, 2012 and 2013 were as follows:
Yen
(millions)
U.S. Dollars
(thousands)
2011 2012 2013 2013
Plant and Equipment, at cost less accumulated
depreciation:
Japan ¥ 870,320 ¥ 780,396 ¥ 461,539 $ 4,962,785
Others 94,594 92,046 102,160 1,098,495
Total ¥ 964,914 ¥ 872,442 ¥ 563,699 $ 6,061,280
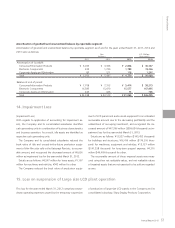
Impairment Loss of fixed assets by reportable segment
Impairment Loss of fixed assets by reportable segment for the years ended March 31, 2011, 2012 and 2013 were as follows:
Yen
(millions)
U.S. Dollars
(thousands)
2011 2012 2013 2013
Impairment Loss:
Consumer/Information Products ¥ — ¥ 542 ¥ 13,374 $ 143,807
Electronic Components — 6,114 65,039 699,344
Corporate Assets and Elimination — — 509 5,473
Total ¥ — ¥ 6,656 ¥ 78,922 $ 848,624
Financial Section
Sales to Apple Inc., of the Company’s Electronic Components segment represents ¥320,433 million ($3,445,516 thousand) of the
Company’s consolidated net sales for the year ended march 31, 2013.