Sharp 2012 Annual Report Download - page 66
Download and view the complete annual report
Please find page 66 of the 2012 Sharp annual report below. You can navigate through the pages in the report by either clicking on the pages listed below, or by using the keyword search tool below to find specific information within the annual report.-
 1
1 -
2
-
3
-
4
-
5
-
6
-
7
-
8
-
9
-
10
-
11
-
12
-
13
-
14
-
15
-
16
-
17
-
18
-
19
-
20
-
21
-
22
-
23
-
24
-
25
-
26
-
27
-
28
-
29
-
30
-
31
-
32
-
33
-
34
-
35
-
36
-
37
-
38
-
39
-
40
-
41
-
42
-
43
-
44
-
45
-
46
-
47
-
48
-
49
-
50
-
51
-
52
-
53
-
54
-
55
-
 56
56 -
 57
57 -
 58
58 -
 59
59 -
 60
60 -
 61
61 -
 62
62 -
 63
63 -
 64
64 -
 65
65 -
 66
66 -
 67
67 -
 68
68 -
 69
69 -
 70
70 -
 71
71 -
 72
72
 |
 |

64 SHARP CORPORATION
Financial Section
Related information
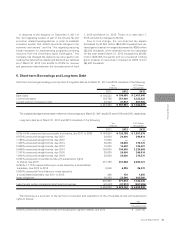
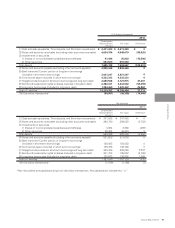
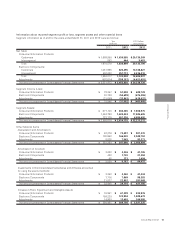
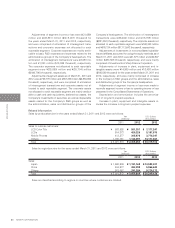
Sales by product/service for the years ended March 31, 2011 and 2012 were as follows:
Sales to outside customers:
LCD Color TVs
LCDs
Mobile Phones
Others
Total
Sales:
Japan
China
Others
Total
¥ 581,357
420,226
305,876
1,148,391
¥ 2,455,850
¥ 1,181,168
483,298
791,384
¥ 2,455,850
¥ 803,592
614,373
413,277
1,190,731
¥ 3,021,973
¥ 1,592,909
516,977
912,087
¥ 3,021,973
$ 7,177,247
5,187,975
3,776,247
14,177,667
$ 30,319,136
$ 14,582,321
5,966,642
9,770,173
$ 30,319,136
2012
2012
2011
2011
Yen
(millions)
Yen
(millions)
2012
2012
U.S. Dollars
(thousands)
U.S. Dollars
(thousands)
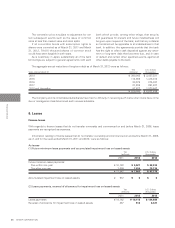
Sales by region/country for the years ended March 31, 2011 and 2012 were as follows:
Sales are classified according to regions or countries where customers are located.
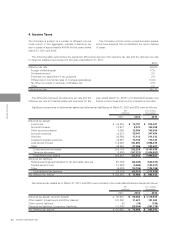
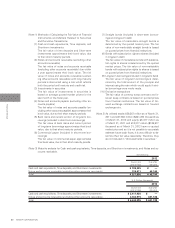
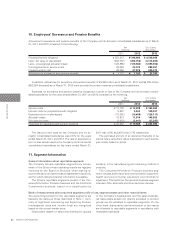
Adjustments of segment income or loss were ¥(31,089)
million and ¥(33,861) million ($(418,037) thousand) for
the years ended March 31, 2011 and 2012, respectively,
and were comprised of elimination of intersegment trans-
actions and corporate expenses not allocated to each
reportable segment. Corporate expenses are mainly attrib-
utable to basic R&D expenses and expenses related to the
administrative groups of the Company’s headquarters. The
elimination of intersegment transactions were ¥3,083 mil-
lion and ¥1,061 million ($13,099 thousand), respectively.
The corporate expenses not allocated to each reportable
segment were ¥(35,880) million and ¥(35,704) million
($(440,790) thousand), respectively.
Adjustments of segment assets as of March 31, 2011 and
2012 were ¥723,779 million and ¥557,336 million ($6,880,692
thousand), respectively, and were comprised of elimination
of intersegment transactions and corporate assets not al-
located to each reportable segment. The corporate assets
not allocated to each reportable segment are mainly attribut-
able to cash and cash equivalents, deferred tax assets, the
Company’s investments in securities, as well as depreciable
assets related to: the Company’s R&D groups as well as
the administrative, sales and distribution groups of the
Company’s headquarters. The elimination of intersegment
transactions were ¥(36,464) million and ¥(18,788) million
($(231,951) thousand), respectively. The corporate assets not
allocated to each reportable segment were ¥760,243 million
and ¥576,124 million ($7,112,642 thousand), respectively.
Adjustments of investments in nonconsolidated subsidiar-
ies and affiliates accounted for using the equity methods as of
March 31, 2011 and 2012 were ¥21,877 million and ¥22,807
million ($281,568 thousand), respectively, and were mainly
comprised of investments in Sharp Finance Corporation.
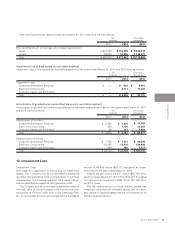
Adjustments of increase in plant, equipment and in-
tangible assets were ¥14,900 million and ¥13,493 million
($166,580 thousand) for the years ended March 31, 2011 and
2012, respectively, and were mainly comprised of increase
in the Company’s R&D groups and the administrative, sales
and distribution groups of the Company’s headquarters.
Adjustments of segment income or loss were made to
reconcile segment income or loss to operating income or loss
presented in the Consolidated Statements of Operations.
Depreciation and amortization includes the amortiza-
tion of long-term prepaid expenses.
Increase in plant, equipment and intangible assets in-
cludes the increase in long-term prepaid expenses.