Sharp 2012 Annual Report Download - page 22
Download and view the complete annual report
Please find page 22 of the 2012 Sharp annual report below. You can navigate through the pages in the report by either clicking on the pages listed below, or by using the keyword search tool below to find specific information within the annual report.-
 1
1 -
2
-
3
-
4
-
5
-
6
-
7
-
8
-
9
-
10
-
11
-
 12
12 -
 13
13 -
 14
14 -
 15
15 -
 16
16 -
 17
17 -
 18
18 -
 19
19 -
 20
20 -
 21
21 -
 22
22 -
 23
23 -
 24
24 -
 25
25 -
 26
26 -
 27
27 -
 28
28 -
 29
29 -
 30
30 -
 31
31 -
 32
32 -
33
-
34
-
35
-
36
-
37
-
38
-
39
-
40
-
41
-
42
-
43
-
44
-
45
-
46
-
47
-
48
-
49
-
50
-
51
-
52
-
53
-
54
-
55
-
56
-
57
-
58
-
59
-
60
-
61
-
62
-
63
-
64
-
65
-
66
-
67
-
68
-
69
-
70
-
71
-
72
 |
 |
20 SHARP CORPORATION
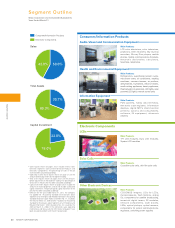
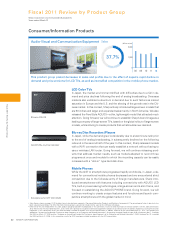
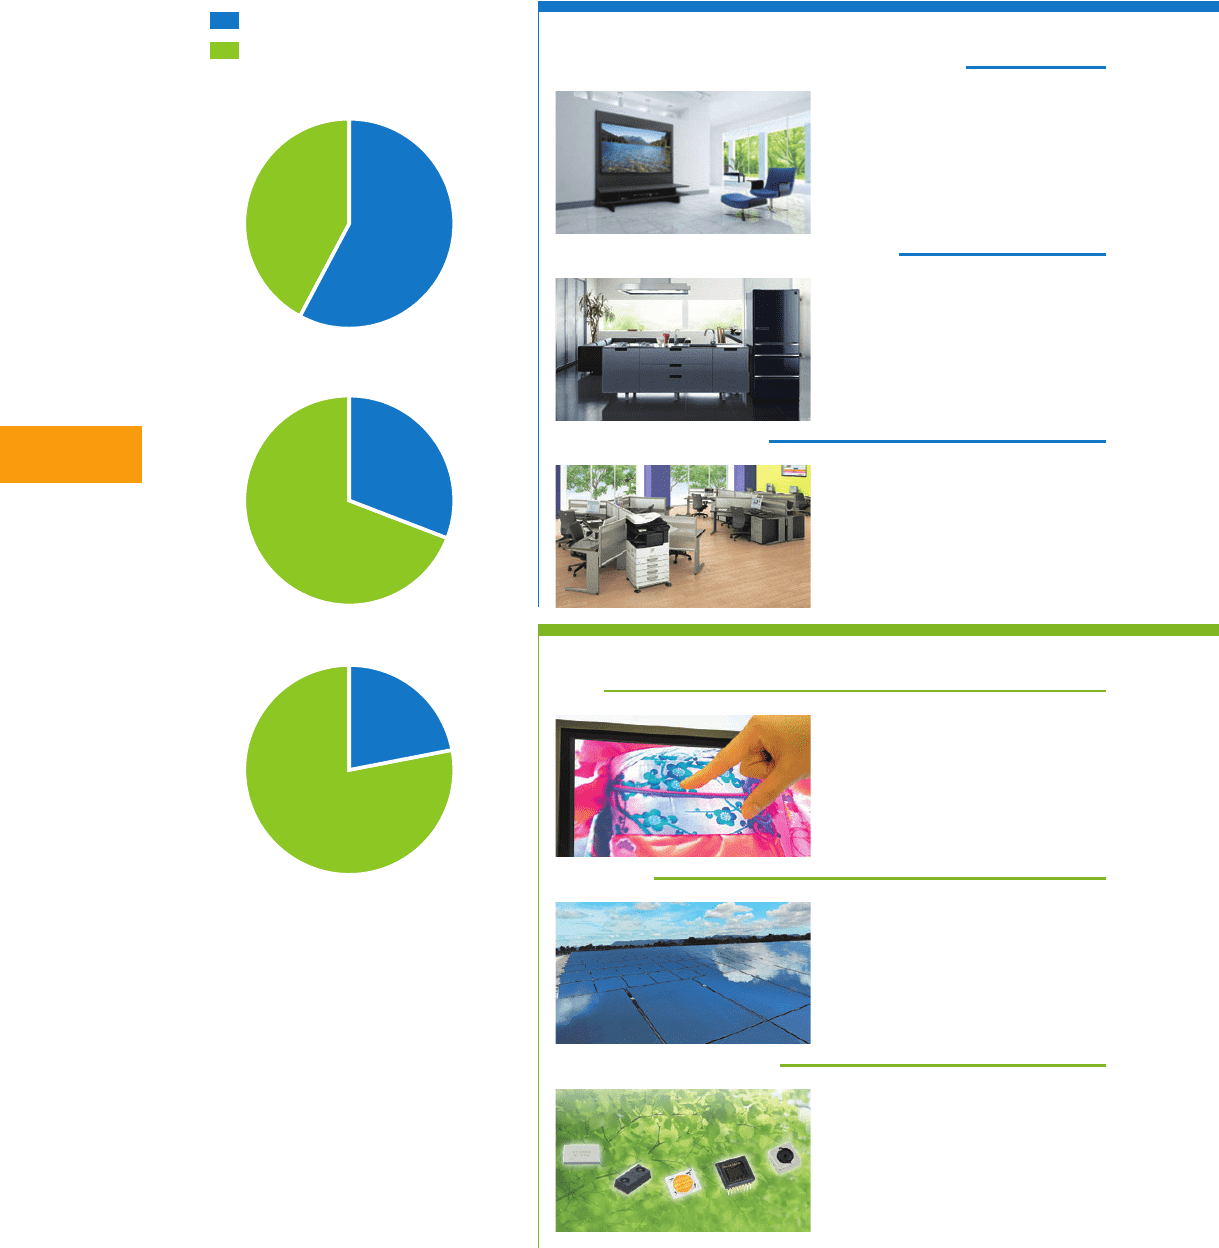
Audio-Visual and Communication Equipment
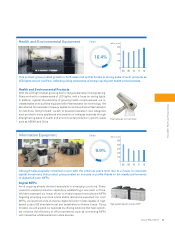
Health and Environmental Equipment
Information Equipment
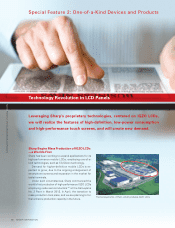
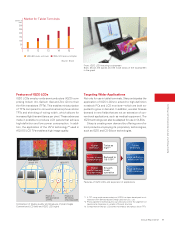
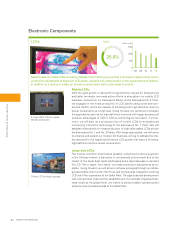
LCDs
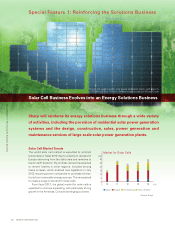
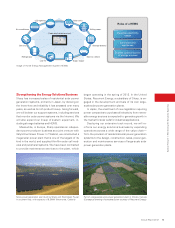
Solar Cells
Other Electronic Devices
Segment Outline
Segment Outline
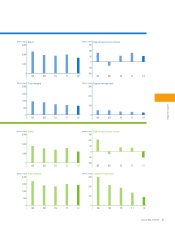
Sharp Corporation and Consolidated Subsidiaries
Years Ended March 31
売上高
総資産
設備投資
Consumer/Information Products
Electronic Components
Sales
Total Assets
Capital Investment
58.0%42.0%
30.7%
69.3%
22.0%
78.0%
58.0%42.0%
30.7%
69.3%
22.0%
78.0%
•Salesfiguresshownonpages20-21includeinternal sales
between segments (Consumer/Information Products and
Electronic Components). The percentage of sales in the pie
chart has been calculated accordingly.
•Operating income(loss)figuresshownonpage21arethe
amounts before adjustment of intersegment trading.
•Totalassetsfiguresshown onpages 20-21are theamounts
before adjustment of intersegment trading. The percentage of
total assets in the pie chart has been calculated accordingly.
•Capitalinvestmentguresshownonpages20-21 includethe
amounts of leased properties, and do not include unallocated
capital investments. The percentage of capital investment in the
pie chart has been calculated accordingly.
•Effective forthe yearendedMarch31,2011,theCompany
has applied the “Accounting Standard for Disclosures about
Segments of an Enterprise and Related Information” (Accounting
Standards Board of Japan (ASBJ) Statement No. 17, issued by
the ASBJ on March 27, 2009) and the “Guidance on Accounting
Standard for Disclosures about Segments of an Enterprise and
Related Information” (ASBJ Guidance No. 20, issued by the
ASBJ on March 21, 2008). In this connection, sales, operating
income (loss) and total assets for 2010 shown on page 21 have
been restated to conform with the 2011 presentation.
Main Products
LCD color televisions, color televisions,
projectors, DVD recorders, Blu-ray Disc
recorders, Blu-ray Disc players, mobile
phones, mobile communications handsets,
electronic dictionaries, calculators,
facsimiles, telephones
Main Products
TFT LCD modules, Duty LCD modules,
System LCD modules
Main Products
Refrigerators, superheated steam ovens,
microwave ovens, air conditioners, washing
machines, vacuum cleaners, air purifiers,
dehumidifiers, humidifiers, electric heaters,
small cooking appliances, beauty appliances,
Plasmacluster Ion generators, LED lights, solar-
powered LED lights, network control units
Main Products
Crystalline solar cells, thin-film solar cells
Main Products
POS systems, handy data terminals,
electronic cash registers, information
displays, digital MFPs (multi-function
printers), options and consumables,
software, FA equipment, ultrasonic
cleaners
Main Products
CCD/CMOS imagers, LSIs for LCDs,
microprocessors, flash memory, analog
ICs, components for satellite broadcasting,
terrestrial digital tuners, RF modules,
network components, laser diodes,
LEDs, optical pickups, optical sensors,
components for optical communications,
regulators, switching power supplies
Consumer/Information Products
Electronic Components