Sharp 2012 Annual Report Download - page 42
Download and view the complete annual report
Please find page 42 of the 2012 Sharp annual report below. You can navigate through the pages in the report by either clicking on the pages listed below, or by using the keyword search tool below to find specific information within the annual report.-
 1
1 -
2
-
3
-
4
-
5
-
6
-
7
-
8
-
9
-
10
-
11
-
12
-
13
-
14
-
15
-
16
-
17
-
18
-
19
-
20
-
21
-
22
-
23
-
24
-
25
-
26
-
27
-
28
-
29
-
30
-
31
-
 32
32 -
 33
33 -
 34
34 -
 35
35 -
 36
36 -
 37
37 -
 38
38 -
 39
39 -
 40
40 -
 41
41 -
 42
42 -
 43
43 -
 44
44 -
 45
45 -
 46
46 -
 47
47 -
 48
48 -
 49
49 -
 50
50 -
 51
51 -
 52
52 -
53
-
54
-
55
-
56
-
57
-
58
-
59
-
60
-
61
-
62
-
63
-
64
-
65
-
66
-
67
-
68
-
69
-
70
-
71
-
72
 |
 |

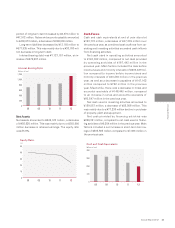
0
1,000
2,000
3,000
4,000
08 09 10 11 12
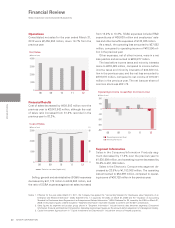
Net Sales
(billions of yen)
-400
-300
-200
-100
0
100
200
Operating income (loss)
Net income (loss)
08 09 10 11 12
Operating Income (Loss)/Net Income (Loss)
(billions of yen)
0
1,000
2,000
3,000
0
30
60
90
Ratio to net sales [right axis]
Cost of Sales
08 09 10 11 12
(billions of yen) (%)
40 SHARP CORPORATION
Financial Section
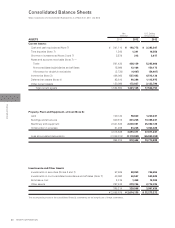
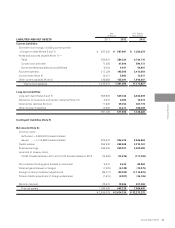
Financial Review
Sharp Corporation and Consolidated Subsidiaries
Operations
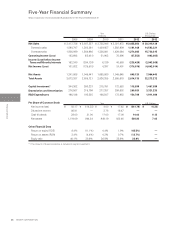
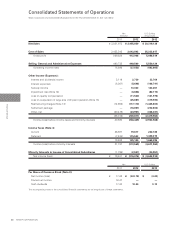
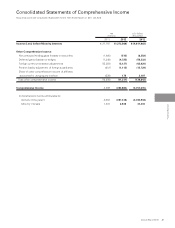
Consolidated net sales for the year ended March 31,
2012 were ¥2,455,850 million, down 18.7% from the
previous year.
Financial Results
Cost of sales decreased by ¥408,503 million over the
previous year to ¥2,043,842 million, although the cost
of sales ratio increased from 81.2% recorded in the
previous year to 83.2%.
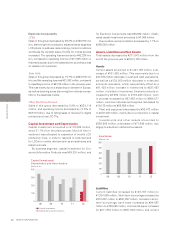
Selling, general and administrative (SG&A) expenses
decreased by ¥41,172 million to ¥449,560 million, and
the ratio of SG&A expenses against net sales increased
from 16.2% to 18.3%. SG&A expenses included R&D
expenditures of ¥36,630 million and employees’ sala-
ries and other benefits expenses of ¥123,025 million.
As a result, the operating loss amounted to ¥37,552
million, compared to operating income of ¥78,896 mil-
lion in the previous year.
Other expenses, net of other income, were in a net
loss position and amounted to ¥200,877 million.
The loss before income taxes and minority interests
came to ¥238,429 million, compared to income before
income taxes and minority interests of ¥40,880 mil-
lion in the previous year, and the net loss amounted to
¥376,076 million, compared to net income of ¥19,401
million in the previous year. The net loss per share of
common stock was ¥341.78.
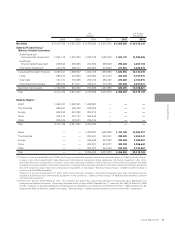
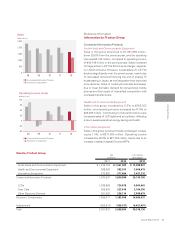
Segment Information
Sales in the Consumer/Information Products seg-
ment decreased by 17.2% over the previous year to
¥1,630,999 million, and operating income decreased by
35.6% to ¥51,008 million.
Sales in the Electronic Components segment de-
creased by 23.9% to ¥1,183,008 million. The operating
loss amounted to ¥54,699 million, compared to operat-
ing income of ¥30,728 million in the previous year.
Notes: 1. Effective for the year ended March 31, 2011, the Company has applied the “Accounting Standard for Disclosures about Segments of an
Enterprise and Related Information” (ASBJ Statement No. 17, issued by the ASBJ on March 27, 2009) and the “Guidance on Accounting
Standard for Disclosures about Segments of an Enterprise and Related Information” (ASBJ Guidance No. 20, issued by the ASBJ on March 21,
2008). In this regard, figures of 2010 included in “Segment Information” have been restated to conform with the 2011 presentation.
2. Sales figures by segment and product group shown in “Segment Information” include internal sales between segments (Consumer/
Information Products and Electronic Components). Operating income (loss) figures are the amounts before adjustment of intersegment trading.
3. Capital investment figures shown in “Capital Investment and Depreciation” include the amount of leased properties.