Sharp 2012 Annual Report Download - page 56
Download and view the complete annual report
Please find page 56 of the 2012 Sharp annual report below. You can navigate through the pages in the report by either clicking on the pages listed below, or by using the keyword search tool below to find specific information within the annual report.-
 1
1 -
2
-
3
-
4
-
5
-
6
-
7
-
8
-
9
-
10
-
11
-
12
-
13
-
14
-
15
-
16
-
17
-
18
-
19
-
20
-
21
-
22
-
23
-
24
-
25
-
26
-
27
-
28
-
29
-
30
-
31
-
32
-
33
-
34
-
35
-
36
-
37
-
38
-
39
-
40
-
41
-
42
-
43
-
44
-
45
-
 46
46 -
 47
47 -
 48
48 -
 49
49 -
 50
50 -
 51
51 -
 52
52 -
 53
53 -
 54
54 -
 55
55 -
 56
56 -
 57
57 -
 58
58 -
 59
59 -
 60
60 -
 61
61 -
 62
62 -
 63
63 -
 64
64 -
 65
65 -
 66
66 -
67
-
68
-
69
-
70
-
71
-
72
 |
 |

54 SHARP CORPORATION
Financial Section
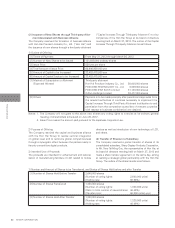
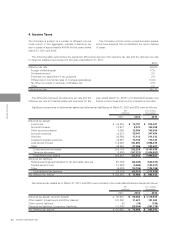
4. Income Taxes
The Company is subject to a number of different income
taxes which, in the aggregate, indicate a statutory tax
rate in Japan of approximately 40.6% for the years ended
March 31, 2011 and 2012.
The Company and its wholly owned domestic subsid-
iaries have adopted the consolidated tax return system
of Japan.
Statutory tax rate
Foreign withholding tax
Dividends income
Expenses not deductible for tax purposes
Differences in normal tax rates of overseas subsidiaries
Tax effect on equity in earnings of affiliates, net
Other
Effective tax rate
40.6 %
17.9
3.3
2.0
(14.6)
(3.3)
2.2
48.1 %
2011
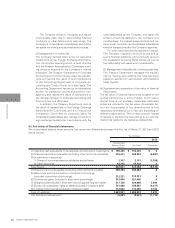
The following table summarizes the significant differences between the statutory tax rate and the effective tax rate
for financial statements purposes for the year ended March 31, 2011:
The difference between the statutory tax rate and the
effective tax rate for financial statement purposes for the
year ended March 31, 2012 is not disclosed because loss
before income taxes and minority interests is recorded.
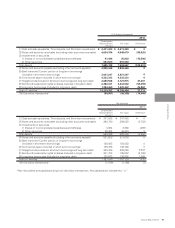
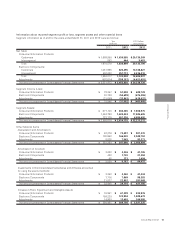
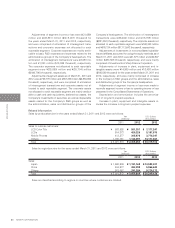
Significant components of deferred tax assets and deferred tax liabilities as of March 31, 2011 and 2012 were as follows:
Deferred tax assets:
Inventories
Accrued bonuses
Other accounts payable
Accrued expenses
Software
Long-term prepaid expenses
Loss carried forward
Other
Gross deferred tax assets
Valuation allowance
Total deferred tax assets
Deferred tax liabilities:
Retained earnings appropriated for tax allowable reserves
Prepaid pension cost
Other
Total deferred tax liabilities
Net deferred tax assets
¥ 40,804
10,972
9,765
14,572
20,569
16,567
115,026
36,864
265,139
(2,897)
262,242
(61,752)
(11,539)
(5,488)
(78,779)
¥ 183,463
¥ 70,797
8,372
12,904
20,047
17,113
14,104
161,893
27,006
332,236
(197,223)
135,013
(42,445)
(9,966)
(10,106)
(62,517)
¥ 72,496
$ 874,037
103,358
159,309
247,494
211,272
174,123
1,998,679
333,407
4,101,679
(2,434,852)
1,666,827
(524,012)
(123,037)
(124,766)
(771,815)
$ 895,012
2011 2012
Yen
(millions)
2012
U.S. Dollars
(thousands)
Net deferred tax assets as of March 31, 2011 and 2012 were included in the consolidated balance sheets as follows:
Deferred tax assets (Current Assets)
Other assets (Investments and Other Assets)
Other current liabilities
Deferred tax liabilities (Long-term Liabilities)
Net deferred tax assets
¥ 93,810
101,259
(6)
(11,600)
¥ 183,463
¥ 90,394
11,421
(15)
(29,304)
¥ 72,496
$ 1,115,975
141,000
(185)
(361,778)
$ 895,012
2011 2012
Yen
(millions)
2012
U.S. Dollars
(thousands)