Sharp 2012 Annual Report Download - page 43
Download and view the complete annual report
Please find page 43 of the 2012 Sharp annual report below. You can navigate through the pages in the report by either clicking on the pages listed below, or by using the keyword search tool below to find specific information within the annual report.-
 1
1 -
2
-
3
-
4
-
5
-
6
-
7
-
8
-
9
-
10
-
11
-
12
-
13
-
14
-
15
-
16
-
17
-
18
-
19
-
20
-
21
-
22
-
23
-
24
-
25
-
26
-
27
-
28
-
29
-
30
-
31
-
32
-
 33
33 -
 34
34 -
 35
35 -
 36
36 -
 37
37 -
 38
38 -
 39
39 -
 40
40 -
 41
41 -
 42
42 -
 43
43 -
 44
44 -
 45
45 -
 46
46 -
 47
47 -
 48
48 -
 49
49 -
 50
50 -
 51
51 -
 52
52 -
 53
53 -
54
-
55
-
56
-
57
-
58
-
59
-
60
-
61
-
62
-
63
-
64
-
65
-
66
-
67
-
68
-
69
-
70
-
71
-
72
 |
 |
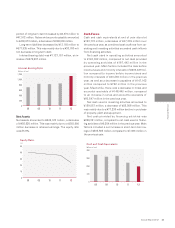
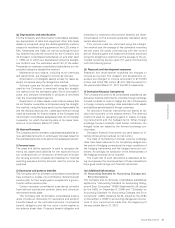
0
500
1,000
1,500
2,000
2,500
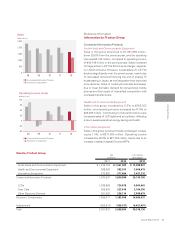
Consumer/Information Products
Electronic Components
08 09 10 11 12
Sales
(billions of yen)
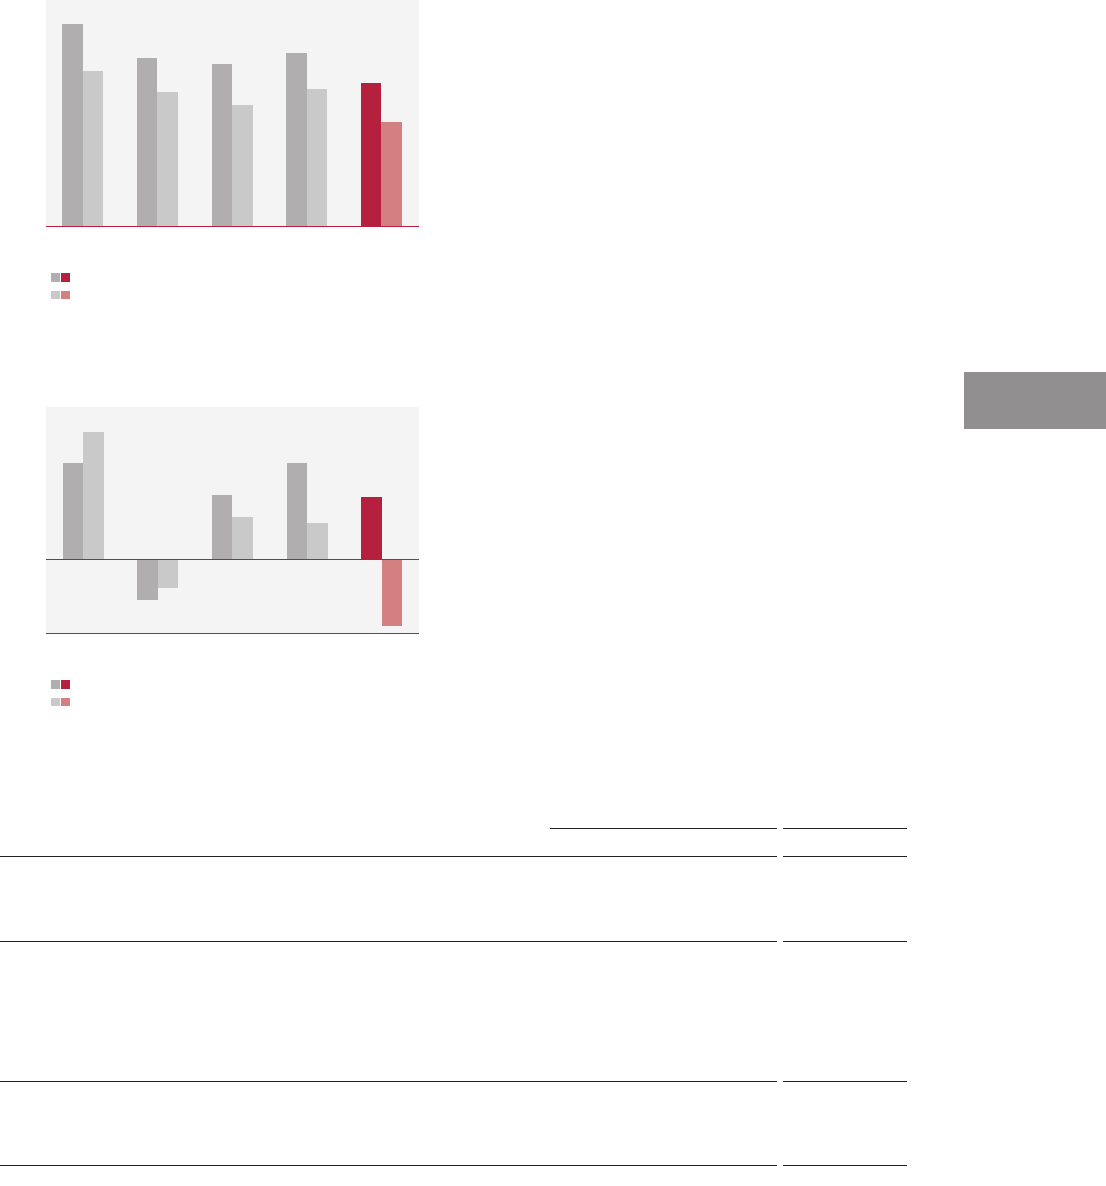
-60
-30
0
30
60
90
120
Consumer/Information Products
Electronic Components
08 09 10 11 12
Operating Income (Loss)
(billions of yen)
Annual Report 2012 41
Financial Section
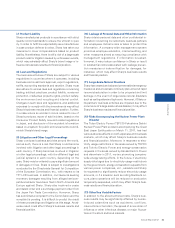
[Reference Information]
Information by Product Group
Consumer/Information Products
Audio-Visual and Communication Equipment
Sales in this group amounted to ¥1,061,092 million,
down 25.6% from the previous year, and the operating
loss was ¥6,194 million, compared to operating income
of ¥40,745 million in the previous year. Sales increased
for large-screen LCD TVs 60 inches and larger, especial-
ly in North America. However, overall sales of LCD TVs
declined significantly over the previous year, mainly due
to decreased demand following the end of analog TV
broadcasting in Japan, as well as greater-than-expected
price declines. Sales of mobile phones also decreased,
due to lower domestic demand for conventional mobile
phones and the impact of intensified competition with
overseas manufacturers.
Health and Environmental Equipment
Sales in this group increased by 8.3% to ¥292,303
million, and operating income increased by 47.6% to
¥29,460 million. Contributing to this performance were
increased sales of LED lights and air purifiers, reflecting
a rise in awareness about energy saving and health.
Information Equipment
Sales in this group remained mostly unchanged, increas-
ing by 1.3%, to ¥277,604 million. Operating income
increased by 49.5% to ¥27,742 million, mainly due to an
increase in sales of digital full-color MFPs.
Audio-Visual and Communication Equipment
Health and Environmental Equipment
Information Equipment
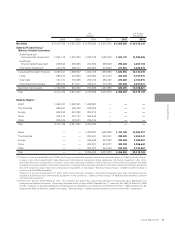
Consumer/Information Products
LCDs
Solar Cells
Other Electronic Devices
Electronic Components
Adjustments
Total
¥ 1,426,734
269,883
273,953
1,970,570
1,026,959
265,538
261,520
1,554,017
(502,614)
3,021,973
¥ 1,061,092
292,303
277,604
1,630,999
720,978
223,916
238,114
1,183,008
(358,157)
2,455,850
$ 13,099,901
3,608,679
3,427,210
20,135,790
8,900,963
2,764,395
2,939,679
14,605,037
(4,421,691)
30,319,136
2011 2012
Yen
(millions)
2012
U.S. Dollars
(thousands)
Sales by Product Group