Sharp 2012 Annual Report Download - page 41
Download and view the complete annual report
Please find page 41 of the 2012 Sharp annual report below. You can navigate through the pages in the report by either clicking on the pages listed below, or by using the keyword search tool below to find specific information within the annual report.-
 1
1 -
2
-
3
-
4
-
5
-
6
-
7
-
8
-
9
-
10
-
11
-
12
-
13
-
14
-
15
-
16
-
17
-
18
-
19
-
20
-
21
-
22
-
23
-
24
-
25
-
26
-
27
-
28
-
29
-
30
-
 31
31 -
 32
32 -
 33
33 -
 34
34 -
 35
35 -
 36
36 -
 37
37 -
 38
38 -
 39
39 -
 40
40 -
 41
41 -
 42
42 -
 43
43 -
 44
44 -
 45
45 -
 46
46 -
 47
47 -
 48
48 -
 49
49 -
 50
50 -
 51
51 -
52
-
53
-
54
-
55
-
56
-
57
-
58
-
59
-
60
-
61
-
62
-
63
-
64
-
65
-
66
-
67
-
68
-
69
-
70
-
71
-
72
 |
 |

Annual Report 2012 39
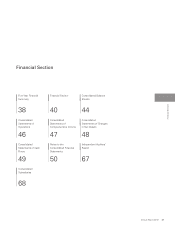
Financial Section
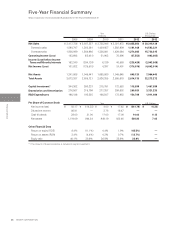
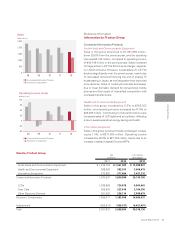
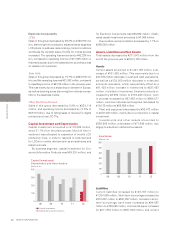
Net Sales
Sales by Product Group*2
(Sales to Outside Customers)
Audio-Visual and
Communication Equipment
Health and
Environmental Equipment
Information Equipment
Consumer/Information Products
LCDs
Solar Cells
Other Electronic Devices
Electronic Components
Total
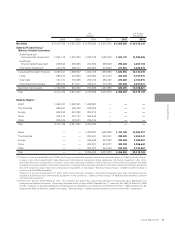
Sales by Region*3
Japan
The Americas
Europe
China
Other
Total
Japan
The Americas
Europe
China
Other
Total
¥ 3,021,973
1,426,243
269,845
273,900
1,969,988
614,373
265,492
172,120
1,051,985
3,021,973
—
—
—
—
—
—
1,592,909
302,021
367,962
516,977
242,104
3,021,973
¥ 2,755,948
1,332,129
244,090
266,920
1,843,139
508,630
208,732
195,447
912,809
2,755,948
1,429,057
342,923
393,212
365,440
225,316
2,755,948
1,429,057
283,641
336,642
422,881
283,727
2,755,948
¥ 2,847,227
1,367,600
225,290
306,077
1,898,967
573,854
157,095
217,311
948,260
2,847,227
1,302,261
488,428
451,090
407,777
197,671
2,847,227
—
—
—
—
—
—
¥ 3,417,736
1,624,713
249,843
410,785
2,285,341
683,310
151,011
298,074
1,132,395
3,417,736
1,590,747
625,841
584,252
412,470
204,426
3,417,736
—
—
—
—
—
—
¥ 2,455,850
1,060,770
292,224
277,561
1,630,555
420,226
223,869
181,200
825,295
2,455,850
—
—
—
—
—
—
1,181,168
288,380
282,606
483,298
220,398
2,455,850
$ 30,319,136
13,095,926
3,607,704
3,426,679
20,130,309
5,187,975
2,763,815
2,237,037
10,188,827
30,319,136
—
—
—
—
—
—
14,582,321
3,560,247
3,488,963
5,966,642
2,720,963
30,319,136
2011201020092008 2012
Yen
(millions)
2012
U.S. Dollars
(thousands)
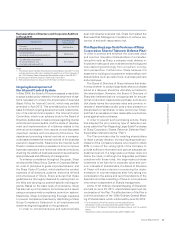
*2 Effective for the year ended March 31, 2009, the Company adopted the segment classification presented above in “Sales by Product Group”
in place of the former classification: Audio-Visual and Communication Equipment, Home Appliances, Information Equipment, LSIs, LCDs,
and Other Electronic Components. In addition, some items previously included in Audio-Visual and Communication Equipment had been
reclassified and were included in Information Equipment, and some items previously included in Information Equipment had been reclassified
and were included in Audio-Visual and Communication Equipment. In this regard, “Sales by Product Group” of 2008 has been restated to
conform with the 2009 presentation.
Effective for the year ended March 31, 2010, some items previously included in Information Equipment have been reclassified and are
included in Audio-Visual and Communication Equipment. In this connection, “Sales by Product Group” of 2009 has been restated to conform
with the 2010 presentation.
*3 Effective for the year ended March 31, 2011, the Company has applied the “Accounting Standard for Disclosures about Segments of an
Enterprise and Related Information” (Accounting Standards Board of Japan (ASBJ) Statement No. 17, issued by the ASBJ on March 27, 2009)
and the “Guidance on Accounting Standard for Disclosures about Segments of an Enterprise and Related Information” (ASBJ Guidance No. 20,
issued by the ASBJ on March 21, 2008). In this regard, “Sales by Region” of 2010 has been restated to conform with the 2011 presentation.