Salesforce.com 2009 Annual Report Download - page 82
Download and view the complete annual report
Please find page 82 of the 2009 Salesforce.com annual report below. You can navigate through the pages in the report by either clicking on the pages listed below, or by using the keyword search tool below to find specific information within the annual report.-
 1
1 -
2
-
3
-
4
-
5
-
6
-
7
-
8
-
9
-
10
-
11
-
12
-
13
-
14
-
15
-
16
-
17
-
18
-
19
-
20
-
21
-
22
-
23
-
24
-
25
-
26
-
27
-
28
-
29
-
30
-
31
-
32
-
33
-
34
-
35
-
36
-
37
-
38
-
39
-
40
-
41
-
42
-
43
-
44
-
45
-
46
-
47
-
48
-
49
-
50
-
51
-
52
-
53
-
54
-
55
-
56
-
57
-
58
-
59
-
60
-
61
-
62
-
63
-
64
-
65
-
66
-
67
-
68
-
69
-
70
-
71
-
 72
72 -
 73
73 -
 74
74 -
 75
75 -
 76
76 -
 77
77 -
 78
78 -
 79
79 -
 80
80 -
 81
81 -
 82
82 -
 83
83 -
 84
84 -
 85
85 -
 86
86 -
 87
87 -
 88
88 -
 89
89 -
 90
90 -
 91
91 -
 92
92 -
93
-
94
-
95
-
96
-
97
-
98
-
99
-
100
-
101
-
102
-
103
-
104
-
105
-
106
-
107
-
108
-
109
-
110
-
111
-
112
-
113
-
114
-
115
-
116
-
117
-
118
-
119
-
120
-
121
-
122
-
123
 |
 |

Table of Contents
salesforce.com, inc.
Notes to Consolidated Financial Statements—(Continued)
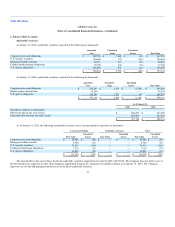
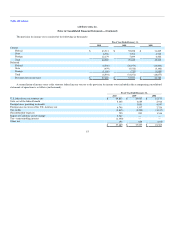
Restricted stock unit activity during fiscal 2010 is as follows:
Restricted Stock Units Outstanding
Outstanding
Weighted-
Average
Exercise Price
Aggregate
Intrinsic
Value
(in thousands)
Balance as of January 31, 2008 1,717,290 $ 0.001
Granted 1,475,314 0.001
Cancelled (157,743) 0.001
Vested and converted to shares (535,710) 0.001
Balance as of January 31, 2009 2,499,151 0.001
Granted 859,636 0.001
Cancelled (212,774) 0.001
Vested and converted to shares (829,561) 0.001
Balance as of January 31, 2010 2,316,452 $ 0.001 $ 147,210
Expected to vest 2,131,271 $ 135,442
The restricted stock units, which upon vesting entitles the holder to one share of common stock for each restricted stock unit, have an exercise price of
$0.001 per share, which is equal to the par value of the Company's common stock, and vest over 4 years.
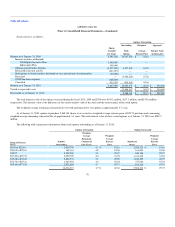
The weighed-average fair value of the restricted stock units issued in fiscal 2010 and 2009 was $47.59 and $39.41, respectively.
The Company realized tax benefits of $50.2 million from the exercise, sale or vesting of stock awards during fiscal 2010.
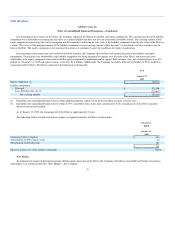
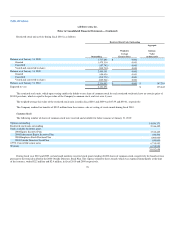
Common Stock
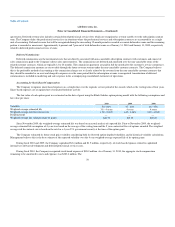
The following number of shares of common stock were reserved and available for future issuance at January 31, 2010:
Options outstanding 14,036,371
Restricted stock units outstanding 2,316,452
Stock available for future grant:
2004 Equity Incentive Plan 3,512,425
2006 Inducement Equity Incentive Plan 436,504
2004 Employee Stock Purchase Plan 1,000,000
2004 Outside Directors Stock Plan 659,000
0.75% Convertible senior notes 6,735,953
Warrants 6,735,953
35,432,658
During fiscal year 2010 and 2009, certain board members received stock grants totaling 48,000 shares of common stock, respectively for board services
pursuant to the terms described in the 2004 Outside Directors Stock Plan. The expense related to these awards, which was expensed immediately at the time
of the issuance, totaled $2.2 million and $2.4 million, in fiscal 2010 and 2009 respectively.
79