Salesforce.com 2009 Annual Report Download - page 49
Download and view the complete annual report
Please find page 49 of the 2009 Salesforce.com annual report below. You can navigate through the pages in the report by either clicking on the pages listed below, or by using the keyword search tool below to find specific information within the annual report.-
 1
1 -
2
-
3
-
4
-
5
-
6
-
7
-
8
-
9
-
10
-
11
-
12
-
13
-
14
-
15
-
16
-
17
-
18
-
19
-
20
-
21
-
22
-
23
-
24
-
25
-
26
-
27
-
28
-
29
-
30
-
31
-
32
-
33
-
34
-
35
-
36
-
37
-
38
-
 39
39 -
 40
40 -
 41
41 -
 42
42 -
 43
43 -
 44
44 -
 45
45 -
 46
46 -
 47
47 -
 48
48 -
 49
49 -
 50
50 -
 51
51 -
 52
52 -
 53
53 -
 54
54 -
 55
55 -
 56
56 -
 57
57 -
 58
58 -
 59
59 -
60
-
61
-
62
-
63
-
64
-
65
-
66
-
67
-
68
-
69
-
70
-
71
-
72
-
73
-
74
-
75
-
76
-
77
-
78
-
79
-
80
-
81
-
82
-
83
-
84
-
85
-
86
-
87
-
88
-
89
-
90
-
91
-
92
-
93
-
94
-
95
-
96
-
97
-
98
-
99
-
100
-
101
-
102
-
103
-
104
-
105
-
106
-
107
-
108
-
109
-
110
-
111
-
112
-
113
-
114
-
115
-
116
-
117
-
118
-
119
-
120
-
121
-
122
-
123
 |
 |

Table of Contents
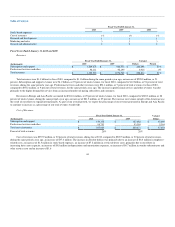
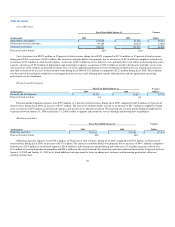
General and administrative expenses were $195.3 million, or 15 percent of total revenues, during fiscal 2010, compared to $158.6 million, or 15 percent
of total revenues, during the same period a year ago, an increase of $36.7 million. The increase was primarily due to increases of $15.7 million in employee-
related costs, $3.0 million in stock-based expenses, $4.7 million in infrastructure-related costs, and $10.1 million in professional and outside service costs.
Our general and administrative headcount increased by 12 percent since January 31, 2009 as we added personnel to support our growth.
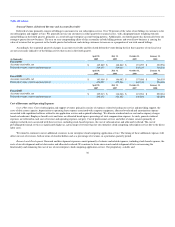
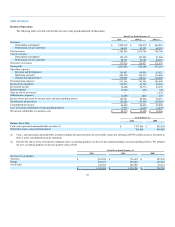
Income from operations.
Fiscal Year Ended January 31, Variance
Dollars
(In thousands) 2010 2009
Income from operations $ 115,272 $ 63,742 $ 51,530
Percent of total revenues 9% 6%
Operating income during fiscal 2010 was $115.3 million and included $88.9 million of stock-based expenses. During the same period a year ago,
operating income was $63.7 million and included $77.4 million of stock-based expenses.
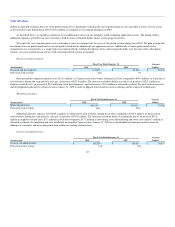
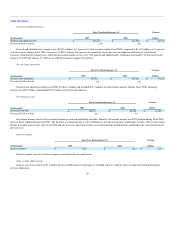
Investment income.
Fiscal Year Ended January 31, Variance
Dollars
(In thousands) 2010 2009
Investment income $ 30,408 $ 22,774 $ 7,634
Percent of total revenues 2% 2%
Investment income consists of income on cash and marketable securities balances. Investment income was $30.4 million during fiscal 2010 and was
$22.8 million during the same period a year ago. The increase was primarily due to increased realized gains and the increase in marketable securities balances
resulting from cash generated by operating activities and the proceeds from stock option exercises.
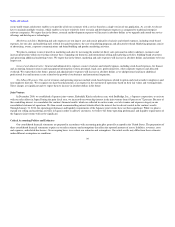
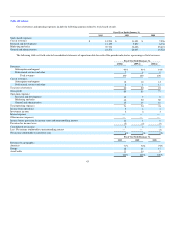
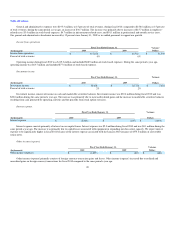
Interest expense.
Fiscal Year Ended January 31, Variance
Dollars
(In thousands) 2010 2009
Interest expense $ (2,000) $ (107) $ (1,893)
Interest expense consists primarily of interest on our capital leases. Interest expense was $2.0 million during fiscal 2010 and was $0.1 million during the
same period a year ago. The increase was primarily due to capital leases associated with equipment in expanding our data center capacity. We expect interest
expense to be significantly higher in fiscal 2011 because of the interest expense associated with the January 2010 issuance of $575.0 million of convertible
senior notes.
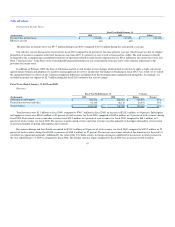
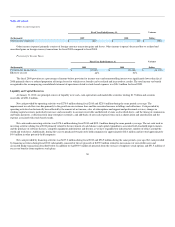
Other income (expense).
Fiscal Year Ended January 31, Variance
Dollars
(In thousands) 2010 2009
Other income (expense) $ (1,299) $ (817) $ (482)
Other income (expense) primarily consists of foreign currency transaction gains and losses. Other income (expense) increased due to realized and
unrealized gains on foreign currency transactions for fiscal 2010 compared to the same period a year ago.
46