Salesforce.com 2009 Annual Report Download - page 45
Download and view the complete annual report
Please find page 45 of the 2009 Salesforce.com annual report below. You can navigate through the pages in the report by either clicking on the pages listed below, or by using the keyword search tool below to find specific information within the annual report.-
 1
1 -
2
-
3
-
4
-
5
-
6
-
7
-
8
-
9
-
10
-
11
-
12
-
13
-
14
-
15
-
16
-
17
-
18
-
19
-
20
-
21
-
22
-
23
-
24
-
25
-
26
-
27
-
28
-
29
-
30
-
31
-
32
-
33
-
34
-
 35
35 -
 36
36 -
 37
37 -
 38
38 -
 39
39 -
 40
40 -
 41
41 -
 42
42 -
 43
43 -
 44
44 -
 45
45 -
 46
46 -
 47
47 -
 48
48 -
 49
49 -
 50
50 -
 51
51 -
 52
52 -
 53
53 -
 54
54 -
 55
55 -
56
-
57
-
58
-
59
-
60
-
61
-
62
-
63
-
64
-
65
-
66
-
67
-
68
-
69
-
70
-
71
-
72
-
73
-
74
-
75
-
76
-
77
-
78
-
79
-
80
-
81
-
82
-
83
-
84
-
85
-
86
-
87
-
88
-
89
-
90
-
91
-
92
-
93
-
94
-
95
-
96
-
97
-
98
-
99
-
100
-
101
-
102
-
103
-
104
-
105
-
106
-
107
-
108
-
109
-
110
-
111
-
112
-
113
-
114
-
115
-
116
-
117
-
118
-
119
-
120
-
121
-
122
-
123
 |
 |

Table of Contents
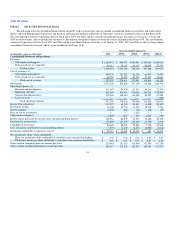
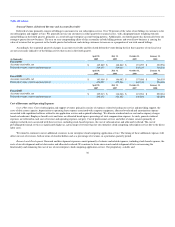
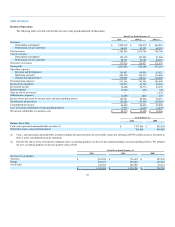
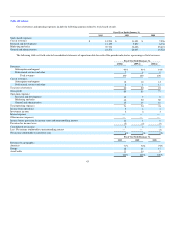
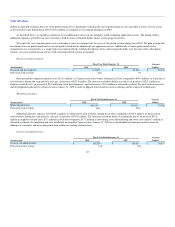
Results of Operations
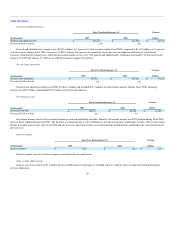
The following tables set forth selected data for each of the periods indicated (in thousands).
Fiscal Year Ended January 31,
2010 2009 (2) 2008 (2)
Revenues:
Subscription and support $ 1,209,472 $ 984,574 $ 680,581
Professional services and other 96,111 92,195 68,119
Total revenues 1,305,583 1,076,769 748,700
Cost of revenues:
Subscription and support 159,172 127,082 91,268
Professional services and other 98,753 93,389 80,323
Total cost of revenues 257,925 220,471 171,591
Gross profit 1,047,658 856,298 577,109
Operating expenses:
Research and development 131,897 99,530 63,812
Marketing and sales 605,199 534,413 376,480
General and administrative 195,290 158,613 116,508
Total operating expenses 932,386 792,556 556,800
Income from operations 115,272 63,742 20,309
Investment income 30,408 22,774 24,539
Interest expense (2,000) (107) (46)
Gain on sale of investment — — 1,272
Other income (expense) (1,299) (817) 139
Income before provision for income taxes and noncontrolling interest 142,381 85,592 46,213
Provision for income taxes (57,689) (37,557) (23,385)
Consolidated net income 84,692 48,035 22,828
Less: net income attributable to noncontrolling interest (3,973) (4,607) (4,472)
Net income attributable to salesforce.com $ 80,719 $ 43,428 $ 18,356
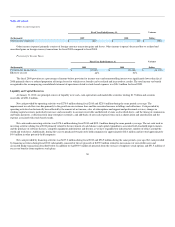
As of January 31,
2010 2009
Balance Sheet Data:
Cash, cash equivalents and marketable securities (1) $ 1,727,048 $ 882,565
Deferred revenue, current and noncurrent 704,348 594,026
(1) Cash, cash equivalents and marketable securities includes the proceeds from our convertible senior note offering of $575.0 million at par as described in
Note 2 in the consolidated financial statements.
(2) Includes the effects of the retrospective adoption of new accounting guidance for the new presentation guidance for noncontrolling interest. We adopted
the new accounting guidance in the first quarter of fiscal 2010.
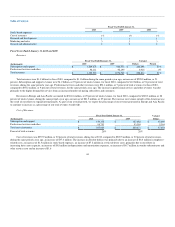
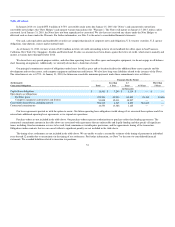
Fiscal Year Ended January 31,
2010 2009 2008
Revenues by geography:
Americas $ 923,823 $ 776,495 $ 557,976
Europe 232,367 190,685 127,010
Asia Pacific 149,393 109,589 63,714
$ 1,305,583 $ 1,076,769 $ 748,700
42