Salesforce.com 2009 Annual Report Download - page 51
Download and view the complete annual report
Please find page 51 of the 2009 Salesforce.com annual report below. You can navigate through the pages in the report by either clicking on the pages listed below, or by using the keyword search tool below to find specific information within the annual report.-
 1
1 -
2
-
3
-
4
-
5
-
6
-
7
-
8
-
9
-
10
-
11
-
12
-
13
-
14
-
15
-
16
-
17
-
18
-
19
-
20
-
21
-
22
-
23
-
24
-
25
-
26
-
27
-
28
-
29
-
30
-
31
-
32
-
33
-
34
-
35
-
36
-
37
-
38
-
39
-
40
-
 41
41 -
 42
42 -
 43
43 -
 44
44 -
 45
45 -
 46
46 -
 47
47 -
 48
48 -
 49
49 -
 50
50 -
 51
51 -
 52
52 -
 53
53 -
 54
54 -
 55
55 -
 56
56 -
 57
57 -
 58
58 -
 59
59 -
 60
60 -
 61
61 -
62
-
63
-
64
-
65
-
66
-
67
-
68
-
69
-
70
-
71
-
72
-
73
-
74
-
75
-
76
-
77
-
78
-
79
-
80
-
81
-
82
-
83
-
84
-
85
-
86
-
87
-
88
-
89
-
90
-
91
-
92
-
93
-
94
-
95
-
96
-
97
-
98
-
99
-
100
-
101
-
102
-
103
-
104
-
105
-
106
-
107
-
108
-
109
-
110
-
111
-
112
-
113
-
114
-
115
-
116
-
117
-
118
-
119
-
120
-
121
-
122
-
123
 |
 |

Table of Contents
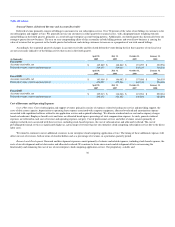
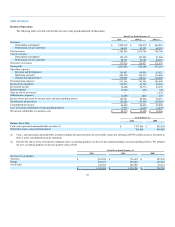
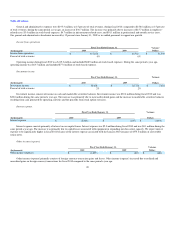
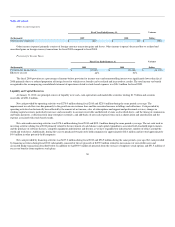
Cost of Revenues.
(In thousands)
Fiscal Year Ended January 31, Variance
Dollars
2009 2008
Subscription and support $ 127,082 $ 91,268 $ 35,814
Professional services and other 93,389 80,323 13,066
Total cost of revenues $ 220,471 $ 171,591 $ 48,880
Percent of total revenues 20% 23%
Cost of revenues was $220.5 million, or 20 percent of total revenues, during fiscal 2009, compared to $171.6 million, or 23 percent of total revenues,
during fiscal 2008, an increase of $48.9 million. The increase in absolute dollars was primarily due to an increase of $13.8 million in employee-related costs,
an increase of $3.1 million in stock-based expenses, an increase of $9.9 million in service delivery costs, primarily due to our efforts in increasing data center
capacity, an increase of $7.2 million in depreciation and amortization expenses, an increase of $10.7 million in outside subcontractor and other service costs
and an increase of $3.3 million in allocated overhead. The cost of the additional professional services headcount resulted in the cost of professional services
and other revenues to be in excess of the related revenue during fiscal 2009 by $1.2 million as compared to $12.2 million during fiscal 2008. This reduction
was the result of increasing the utilization of existing professional services staff, utilizing more outside subcontractors and not significantly increasing
professional services headcount.
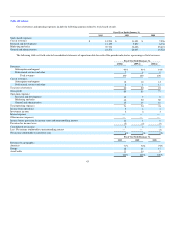
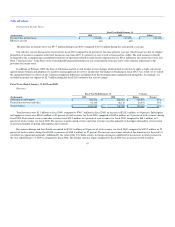
Research and Development.
(In thousands)
Fiscal Year Ended January 31, Variance
Dollars
2009 2008
Research and development $ 99,530 $ 63,812 $ 35,718
Percent of total revenues 9% 8%
Research and development expenses were $99.5 million, or 9 percent of total revenues, during fiscal 2009, compared to $63.8 million, or 8 percent of
total revenues, during fiscal 2008, an increase of $35.7 million. The increase in absolute dollars was due to an increase of $27.4 million in employee-related
costs, an increase of $3.5 million in stock-based expenses, and an increase in allocated overhead. We increased our research and development headcount by
61 percent between January 31, 2008 and January 31, 2009 in order to upgrade and extend our service offerings and develop new technologies.
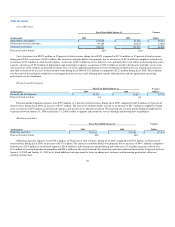
Marketing and Sales.
(In thousands)
Fiscal Year Ended January 31, Variance
Dollars
2009 2008
Marketing and sales $ 534,413 $ 376,480 $ 157,933
Percent of total revenues 50% 50%
Marketing and sales expenses were $534.4 million, or 50 percent of total revenues, during fiscal 2009, compared to $376.5 million, or 50 percent of
total revenues, during fiscal 2008, an increase of $157.9 million. The increase in absolute dollars was primarily due to increases of $94.1 million in employee-
related costs, $10.6 million in stock-based expenses, $28.9 million in advertising costs and marketing and event costs, $1.6 million in partner referral fees,
$1.4 million of amortized purchased intangibles and $20.3 million in allocated overhead. Our marketing and sales headcount increased by 40 percent between
January 31, 2008 and January 31, 2009 as we hired additional sales personnel to focus on adding new customers and increasing penetration within our
existing customer base.
48