Salesforce.com 2009 Annual Report Download - page 66
Download and view the complete annual report
Please find page 66 of the 2009 Salesforce.com annual report below. You can navigate through the pages in the report by either clicking on the pages listed below, or by using the keyword search tool below to find specific information within the annual report.-
 1
1 -
2
-
3
-
4
-
5
-
6
-
7
-
8
-
9
-
10
-
11
-
12
-
13
-
14
-
15
-
16
-
17
-
18
-
19
-
20
-
21
-
22
-
23
-
24
-
25
-
26
-
27
-
28
-
29
-
30
-
31
-
32
-
33
-
34
-
35
-
36
-
37
-
38
-
39
-
40
-
41
-
42
-
43
-
44
-
45
-
46
-
47
-
48
-
49
-
50
-
51
-
52
-
53
-
54
-
55
-
 56
56 -
 57
57 -
 58
58 -
 59
59 -
 60
60 -
 61
61 -
 62
62 -
 63
63 -
 64
64 -
 65
65 -
 66
66 -
 67
67 -
 68
68 -
 69
69 -
 70
70 -
 71
71 -
 72
72 -
 73
73 -
 74
74 -
 75
75 -
 76
76 -
77
-
78
-
79
-
80
-
81
-
82
-
83
-
84
-
85
-
86
-
87
-
88
-
89
-
90
-
91
-
92
-
93
-
94
-
95
-
96
-
97
-
98
-
99
-
100
-
101
-
102
-
103
-
104
-
105
-
106
-
107
-
108
-
109
-
110
-
111
-
112
-
113
-
114
-
115
-
116
-
117
-
118
-
119
-
120
-
121
-
122
-
123
 |
 |

Table of Contents
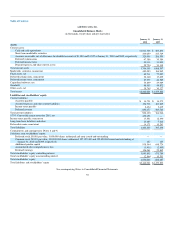
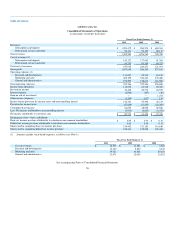
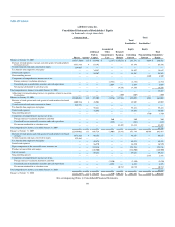
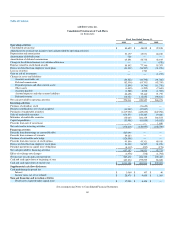
salesforce.com, inc.
Notes to Consolidated Financial Statements—(Continued)
including key operational and cash flow metrics, current market conditions and our intent and ability to retain the investment for a period of time sufficient to
allow for any anticipated recovery in fair market value.
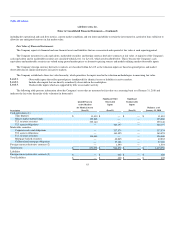
Fair Value of Financial Instruments
The Company reports its financial and non-financial assets and liabilities that are re-measured and reported at fair value at each reporting period.
The Company measures its cash equivalents, marketable securities and foreign currency derivative contracts at fair value. A majority of the Company's
cash equivalents and its marketable securities are classified within Level 1 or Level 2, which are described below. This is because the Company's cash
equivalents and marketable securities are valued using quoted market prices or alternative pricing sources and models utilizing market observable inputs.
The Company's foreign currency derivative contracts are classified within Level 2 as the valuation inputs are based on quoted prices and market
observable data of similar instruments in inactive markets.
The Company established a three-tier value hierarchy, which prioritizes the inputs used in the valuation methodologies in measuring fair value:
Level 1. Observable inputs that reflect quoted prices (unadjusted) for identical assets or liabilities in active markets.
Level 2. Include other inputs that are directly or indirectly observable in the marketplace.
Level 3. Unobservable inputs which are supported by little or no market activity.
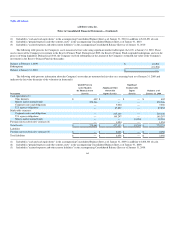
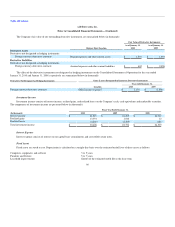
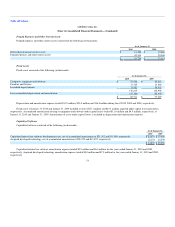
The following table presents information about the Company's assets that are measured at fair value on a recurring basis as of January 31, 2010 and
indicates the fair value hierarchy of the valuation (in thousands):
Description
Quoted Prices in
Active Markets
for Identical Assets
(Level 1)
Significant Other
Observable
Inputs
(Level 2)
Significant
Unobservable
Inputs
(Level 3)
Balances as of
January 31, 2010
Cash equivalents (1):
Time deposits $ 11,410 $ — $ — $ 11,410
Money market mutual funds 123,868 — — 123,868
U.S. treasury securities 399,140 — — 399,140
U.S. agency obligations — 364,197 — 364,197
Marketable securities:
Corporate notes and obligations — 337,574 — 337,574
U.S. agency obligations — 163,455 — 163,455
U.S. treasury securities 136,660 — — 136,660
Mortgage backed securities — 40,865 — 40,865
Collateralized mortgage obligations — 37,188 — 37,188
Foreign currency derivative contracts (2) — 1,593 — 1,593
Total Assets $ 671,078 $ 944,872 $ — $ 1,615,950
Liabilities
Foreign currency derivative contracts (3) $ — $ 402 $ — $ 402
Total Liabilities $ — $ 402 $ — $ 402
63