Salesforce.com 2009 Annual Report Download - page 52
Download and view the complete annual report
Please find page 52 of the 2009 Salesforce.com annual report below. You can navigate through the pages in the report by either clicking on the pages listed below, or by using the keyword search tool below to find specific information within the annual report.-
 1
1 -
2
-
3
-
4
-
5
-
6
-
7
-
8
-
9
-
10
-
11
-
12
-
13
-
14
-
15
-
16
-
17
-
18
-
19
-
20
-
21
-
22
-
23
-
24
-
25
-
26
-
27
-
28
-
29
-
30
-
31
-
32
-
33
-
34
-
35
-
36
-
37
-
38
-
39
-
40
-
41
-
 42
42 -
 43
43 -
 44
44 -
 45
45 -
 46
46 -
 47
47 -
 48
48 -
 49
49 -
 50
50 -
 51
51 -
 52
52 -
 53
53 -
 54
54 -
 55
55 -
 56
56 -
 57
57 -
 58
58 -
 59
59 -
 60
60 -
 61
61 -
 62
62 -
63
-
64
-
65
-
66
-
67
-
68
-
69
-
70
-
71
-
72
-
73
-
74
-
75
-
76
-
77
-
78
-
79
-
80
-
81
-
82
-
83
-
84
-
85
-
86
-
87
-
88
-
89
-
90
-
91
-
92
-
93
-
94
-
95
-
96
-
97
-
98
-
99
-
100
-
101
-
102
-
103
-
104
-
105
-
106
-
107
-
108
-
109
-
110
-
111
-
112
-
113
-
114
-
115
-
116
-
117
-
118
-
119
-
120
-
121
-
122
-
123
 |
 |

Table of Contents
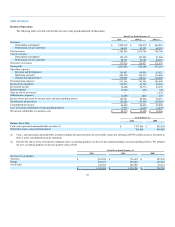
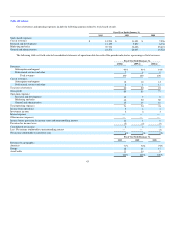
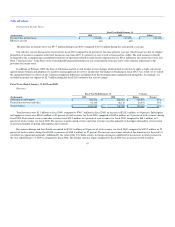
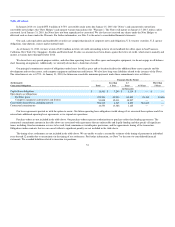
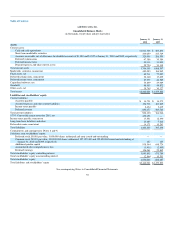
General and Administrative.
(In thousands)
Fiscal Year Ended January 31, Variance
Dollars
2009 2008
General and administrative $ 158,613 $ 116,508 $ 42,105
Percent of total revenues 15% 16%
General and administrative expenses were $158.6 million, or 15 percent of total revenues, during fiscal 2009, compared to $116.5 million, or 16 percent
of total revenues, during fiscal 2008, an increase of $42.1 million. The increase was primarily due to increases in employee-related costs, stock-based
expenses, infrastructure-related costs, and professional and outside service costs. Our general and administrative headcount increased by 30 percent between
January 31, 2008 and January 31, 2009 as we added personnel to support our growth.
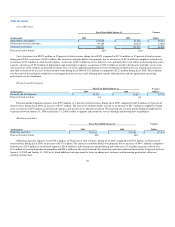
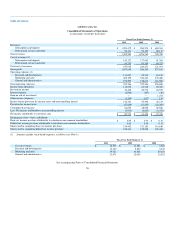
Income from operations.
(In thousands)
Fiscal Year Ended January 31, Variance
Dollars
2009 2008
Income from operations $ 63,742 $ 20,309 $ 43,433
Percent of total revenues 6% 3%
Income from operations during fiscal 2009 was $63.7 million and included $77.4 million of stock-based expenses. During fiscal 2008, operating
income was $20.3 million and included $55.2 million of stock-based expenses.
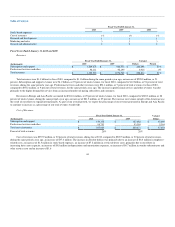
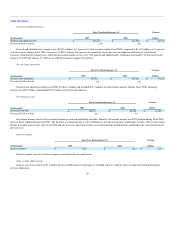
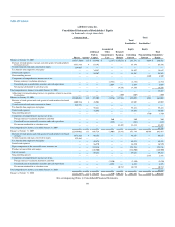
Investment income.
(In thousands)
Fiscal Year Ended January 31, Variance
Dollars 2009 2008
Investment income $ 22,774 $ 24,539 $ (1,765)
Percent of total revenues 2% 3%
Investment income consists of investment income on cash and marketable securities balances. Investment income was $22.8 million during fiscal 2009
and was $24.5 million during fiscal 2008. The decrease was primarily due to a $2.0 million loss for our investment in marketable securities. Due to the current
decline in market interest rates since fiscal 2008 and our focus on capital preservation, investment income declined when compared to the same periods in the
previous year.
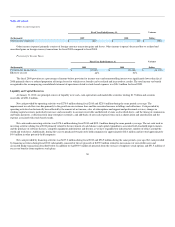
Interest expense.
(In thousands)
Fiscal Year Ended January 31, Variance
Dollars 2009 2008
Interest expense $ (107) $ (46) $ (61)
Interest expense consists of interest expense associated with our capital leases.
Gain on Sale of Investment.
Gain on sale of investment of $1.3 million for fiscal 2008 consists of the gain we recorded when we sold our shares in a privately held professional
service corporation.
49