Salesforce.com 2009 Annual Report Download - page 62
Download and view the complete annual report
Please find page 62 of the 2009 Salesforce.com annual report below. You can navigate through the pages in the report by either clicking on the pages listed below, or by using the keyword search tool below to find specific information within the annual report.-
 1
1 -
2
-
3
-
4
-
5
-
6
-
7
-
8
-
9
-
10
-
11
-
12
-
13
-
14
-
15
-
16
-
17
-
18
-
19
-
20
-
21
-
22
-
23
-
24
-
25
-
26
-
27
-
28
-
29
-
30
-
31
-
32
-
33
-
34
-
35
-
36
-
37
-
38
-
39
-
40
-
41
-
42
-
43
-
44
-
45
-
46
-
47
-
48
-
49
-
50
-
51
-
 52
52 -
 53
53 -
 54
54 -
 55
55 -
 56
56 -
 57
57 -
 58
58 -
 59
59 -
 60
60 -
 61
61 -
 62
62 -
 63
63 -
 64
64 -
 65
65 -
 66
66 -
 67
67 -
 68
68 -
 69
69 -
 70
70 -
 71
71 -
 72
72 -
73
-
74
-
75
-
76
-
77
-
78
-
79
-
80
-
81
-
82
-
83
-
84
-
85
-
86
-
87
-
88
-
89
-
90
-
91
-
92
-
93
-
94
-
95
-
96
-
97
-
98
-
99
-
100
-
101
-
102
-
103
-
104
-
105
-
106
-
107
-
108
-
109
-
110
-
111
-
112
-
113
-
114
-
115
-
116
-
117
-
118
-
119
-
120
-
121
-
122
-
123
 |
 |

Table of Contents
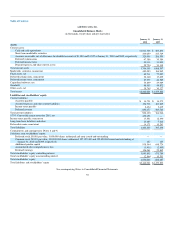
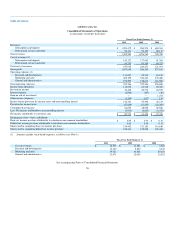
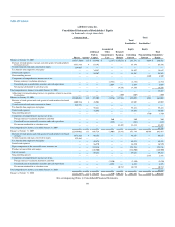
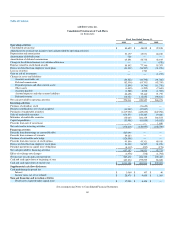
salesforce.com, inc.
Consolidated Statements of Stockholders' Equity
(in thousands, except share data)
Common Stock
Additional
Paid-in
Capital
Accumulated
Other
Comprehensive
Loss
Retained
Earnings
(Deficit)
Total
Stockholders'
Equity
Controlling
Interest
Total
Stockholders'
Equity
Noncontrolling
Interest
Total
Stockholders'
Equity Shares Amount
Balances at January 31, 2007 114,537,560 $ 115 $ 319,496 $ (2,187) $ (35,633) $ 281,791 $ 4,634 $ 286,425
Exercise of stock options, warrants and stock grants to board members
for board services 4,533,418 4 63,192 — — 63,196 — 63,196
Vested restricted stock units converted to shares 234,035 — — — — — — —
Tax benefits from employee stock plans — — 34,847 — — 34,847 — 34,847
Stock-based expenses — — 54,267 — — 54,267 — 54,267
Noncontrolling interest — — — — — — 4,309 4,309
Components of comprehensive income, net of tax:
Foreign currency translation adjustment — — — (2,753) — (2,753) — (2,753)
Unrealized gain on marketable securities and cash equivalents — — — 2,664 — 2,664 — 2,664
Net income attributable to salesforce.com — — — — 18,356 18,356 — 18,356
Total comprehensive income, year ended January 31, 2008 — — — — — — — 18,267
Adjustment to retained earnings for new tax guidance related to uncertain
tax positions — — — — (309) (309) — (309)
Balances at January 31, 2008 119,305,013 119 471,802 (2,276) (17,586) 452,059 8,943 461,002
Exercise of stock options and stock grants to board members for board
services 3,009,276 4 45,903 — — 45,907 — 45,907
Vested restricted stock units converted to shares 535,773 — — — — — — —
Tax benefits from employee stock plans — — 55,421 — — 55,421 — 55,421
Stock-based expenses — — 75,598 — — 75,598 — 75,598
Noncontrolling interest — — — — — — 1,760 1,760
Components of comprehensive income, net of tax:
Foreign currency translation adjustment and other — — — 260 — 260 — 260
Unrealized loss on marketable securities and cash equivalents — — — (889) — (889) — (889)
Net income attributable to salesforce.com — — — — 43,428 43,428 — 43,428
Total comprehensive income, year ended January 31, 2009 — — — — — — — 42,799
Balances at January 31, 2009 122,850,062 123 648,724 (2,905) 25,842 671,784 10,703 682,487
Exercise of stock options and stock grants to board members for board
services 3,472,826 4 96,153 — — 96,157 — 96,157
Vested restricted stock units converted to shares 829,561 — — — — — — —
Tax benefits from employee stock plans — — 49,478 — — 49,478 — 49,478
Stock-based expenses — — 86,570 — — 86,570 — 86,570
Equity component of the convertible notes issuance, net. — — 124,836 — — 124,836 — 124,836
Purchase of convertible note hedges — — (126,500) — — (126,500) — (126,500)
Sale of warrants — — 59,283 — — 59,283 — 59,283
Noncontrolling interest — — — — — — 2,161 2,161
Components of comprehensive income, net of tax:
Foreign currency translation adjustment and other — — — (2,820) — (2,820) — (2,820)
Unrealized gain on marketable securities and cash equivalents — — — 4,295 — 4,295 — 4,295
Net income attributable to salesforce.com — — — — 80,719 80,719 — 80,719
Total comprehensive income, year ended January 31, 2010 — — — — — — — 82,194
Balances at January 31, 2010 127,152,449 $ 127 $ 938,544 $ (1,430) $106,561 $ 1,043,802 $ 12,864 $ 1,056,666
See accompanying Notes to Consolidated Financial Statements.
59