Rite Aid 2013 Annual Report Download - page 80
Download and view the complete annual report
Please find page 80 of the 2013 Rite Aid annual report below. You can navigate through the pages in the report by either clicking on the pages listed below, or by using the keyword search tool below to find specific information within the annual report.-
 1
1 -
2
-
3
-
4
-
5
-
6
-
7
-
8
-
9
-
10
-
11
-
12
-
13
-
14
-
15
-
16
-
17
-
18
-
19
-
20
-
21
-
22
-
23
-
24
-
25
-
26
-
27
-
28
-
29
-
30
-
31
-
32
-
33
-
34
-
35
-
36
-
37
-
38
-
39
-
40
-
41
-
42
-
43
-
44
-
45
-
46
-
47
-
48
-
49
-
50
-
51
-
52
-
53
-
54
-
55
-
56
-
57
-
58
-
59
-
60
-
61
-
62
-
63
-
64
-
65
-
66
-
67
-
68
-
69
-
 70
70 -
 71
71 -
 72
72 -
 73
73 -
 74
74 -
 75
75 -
 76
76 -
 77
77 -
 78
78 -
 79
79 -
 80
80 -
 81
81 -
 82
82 -
 83
83 -
 84
84 -
 85
85 -
 86
86 -
 87
87 -
 88
88 -
 89
89 -
 90
90 -
91
-
92
-
93
-
94
-
95
-
96
-
97
-
98
-
99
-
100
-
101
-
102
-
103
-
104
-
105
-
106
-
107
-
108
-
109
-
110
-
111
-
112
-
113
-
114
-
115
-
116
-
117
-
118
-
119
-
120
-
121
-
122
-
123
-
124
-
125
 |
 |
RITE AID CORPORATION AND SUBSIDIARIES
NOTES TO CONSOLIDATED FINANCIAL STATEMENTS (Continued)
For the Years Ended March 2, 2013, March 3, 2012 and February 26, 2011
(In thousands, except per share amounts)
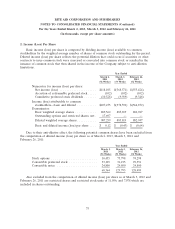
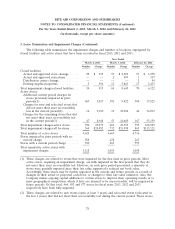
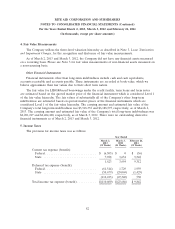
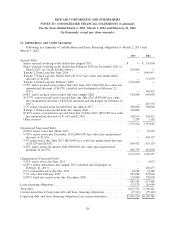
3. Lease Termination and Impairment Charges (Continued)
have not met their original return on investment projections and have a historical loss of at least
2 years. Their future cash flow projections do not recover their current carrying value. Of this
total, 14, 19 and 43 stores for fiscal years 2013, 2012 and 2011 respectively have been fully
impaired.
(3) These charges are related to the remaining active stores that did not meet the recoverability test
during the current period. These stores have a historical loss of at least 2 years. Their future cash
flow projections do not recover their current carrying value. Of this total, 43, 43 and 141 stores for
fiscal years 2013, 2012 and 2011 respectively have been fully impaired.
The primary drivers of its impairment charges are each store’s current and historical operating
performance and the assumptions that the Company makes about each store’s operating performance
in future periods. Projected cash flows are updated based on the next year’s operating budget which
includes the qualitative factors noted above. The Company is unable to predict with any degree of
certainty which individual stores will fall short or exceed future operating plans. Accordingly, the
Company is unable to describe future trends that would affect its impairment charges, including the
likely stores and their related asset values that may fail their recoverability test in future periods.
The Company utilizes the three-level valuation hierarchy for the recognition and disclosure of fair
value measurements. The categorization of assets and liabilities within this hierarchy is based upon the
lowest level of input that is significant to the measurement of fair value. The three levels of the
hierarchy consist of the following:
• Level 1—Inputs to the valuation methodology are unadjusted quoted prices in active markets for
identical assets or liabilities that the Company has the ability to access at the measurement date.
• Level 2—Inputs to the valuation methodology are quoted prices for similar assets and liabilities
in active markets, quoted prices in markets that are not active or inputs that are observable for
the asset or liability, either directly or indirectly, for substantially the full term of the instrument.
• Level 3—Inputs to the valuation methodology are unobservable inputs based upon
management’s best estimate of inputs market participants could use in pricing the asset or
liability at the measurement date, including assumptions about risk.
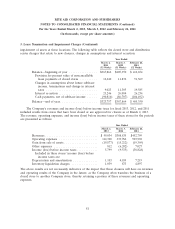
Long-lived non-financial assets are measured at fair value on a nonrecurring basis for purposes of
calculating impairment using Level 2 and Level 3 inputs as defined in the fair value hierarchy. The fair
value of long-lived assets using Level 2 inputs is determined by evaluating the current economic
conditions in the geographic area for similar use assets. The fair value of long-lived assets using Level 3
inputs is determined by estimating the amount and timing of net future cash flows (which are
unobservable inputs) and discounting them using a risk-adjusted rate of interest (which is Level 1). The
Company estimates future cash flows based on its experience and knowledge of the market in which
the store is located. Significant increases or decreases in actual cash flows may result in valuation
changes.
79