Rite Aid 2013 Annual Report Download - page 26
Download and view the complete annual report
Please find page 26 of the 2013 Rite Aid annual report below. You can navigate through the pages in the report by either clicking on the pages listed below, or by using the keyword search tool below to find specific information within the annual report.-
 1
1 -
2
-
3
-
4
-
5
-
6
-
7
-
8
-
9
-
10
-
11
-
12
-
13
-
14
-
15
-
 16
16 -
 17
17 -
 18
18 -
 19
19 -
 20
20 -
 21
21 -
 22
22 -
 23
23 -
 24
24 -
 25
25 -
 26
26 -
 27
27 -
 28
28 -
 29
29 -
 30
30 -
 31
31 -
 32
32 -
 33
33 -
 34
34 -
 35
35 -
 36
36 -
37
-
38
-
39
-
40
-
41
-
42
-
43
-
44
-
45
-
46
-
47
-
48
-
49
-
50
-
51
-
52
-
53
-
54
-
55
-
56
-
57
-
58
-
59
-
60
-
61
-
62
-
63
-
64
-
65
-
66
-
67
-
68
-
69
-
70
-
71
-
72
-
73
-
74
-
75
-
76
-
77
-
78
-
79
-
80
-
81
-
82
-
83
-
84
-
85
-
86
-
87
-
88
-
89
-
90
-
91
-
92
-
93
-
94
-
95
-
96
-
97
-
98
-
99
-
100
-
101
-
102
-
103
-
104
-
105
-
106
-
107
-
108
-
109
-
110
-
111
-
112
-
113
-
114
-
115
-
116
-
117
-
118
-
119
-
120
-
121
-
122
-
123
-
124
-
125
 |
 |

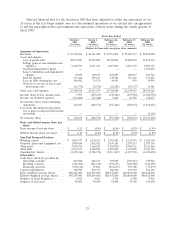
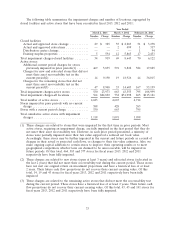
Selected financial data for the fiscal year 2009 has been adjusted to reflect the operations of our
28 stores in the Las Vegas market area as a discontinued operations as we entered into an agreement
to sell the prescription files and terminate the operations of these stores during the fourth quarter of
fiscal 2008.
Fiscal Year Ended
March 2, March 3, February 26, February 27, February 28,
2013 2012 2011 2010 2009
(52 weeks) (53 weeks) (52 weeks) (52 weeks) (52 weeks)
(Dollars in thousands, except per share amounts)
Summary of Operations:
Revenues ................... $25,392,263 $ 26,121,222 $ 25,214,907 $ 25,669,117 $ 26,289,268
Costs and expense:
Cost of goods sold ........... 18,073,987 19,327,887 18,522,403 18,845,027 19,253,616
Selling, general and administrative
expenses ................. 6,600,765 6,531,411 6,457,833 6,603,372 6,985,367
Goodwill impairment charge ..... ————1,810,223
Lease termination and impairment
charges ................. 70,859 100,053 210,893 208,017 293,743
Interest expense ............. 515,421 529,255 547,581 515,763 477,627
Loss on debt retirements, net .... 140,502 33,576 44,003 993 39,905
(Gain) loss on sale of assets and
investments, net ............ (16,776) (8,703) (22,224) (24,137) 11,581
Total costs and expenses ......... 25,384,758 26,513,479 25,760,489 26,149,035 28,872,062
Income (loss) before income taxes . . 7,505 (392,257) (545,582) (479,918) (2,582,794)
Income tax (benefit) expense ...... (110,600) (23,686) 9,842 26,758 329,257
Net income (loss) from continuing
operations ................. 118,105 (368,571) (555,424) (506,676) (2,912,051)
Loss from discontinued operations,
net of gain on disposal and income
tax benefit ................. ————(3,369)
Net income (loss) ............. $ 118,105 $ (368,571) $ (555,424) $ (506,676) $ (2,915,420)
Basic and diluted income (loss) per
share:
Basic income (loss) per share ..... $ 0.12 $ (0.43) $ (0.64) $ (0.59) $ (3.49)
Diluted income (loss) per share .... $ 0.12 $ (0.43) $ (0.64) $ (0.59) $ (3.49)
Year-End Financial Position:
Working capital ............... $ 1,830,777 $ 1,934,267 $ 1,991,042 $ 2,332,976 $ 2,062,505
Property, plant and equipment, net . . 1,895,650 1,902,021 2,039,383 2,293,153 2,587,356
Total assets .................. 7,078,719 7,364,291 7,555,850 8,049,911 8,326,540
Total debt ................... 6,033,531 6,328,201 6,219,865 6,370,899 6,011,709
Stockholders’ deficit ............ (2,459,434) (2,586,756) (2,211,367) (1,673,551) (1,199,652)
Other Data:
Cash flows (used in) provided by:
Operating activities ........... 819,588 266,537 395,849 (325,063) 359,910
Investing activities ............ (346,305) (221,169) (156,677) (120,486) (346,358)
Financing activities ........... (506,116) 25,801 (251,650) 397,108 (17,279)
Capital expenditures ............ 382,980 250,137 186,520 193,630 541,346
Basic weighted average shares ..... 889,562,000 885,819,000 882,947,000 880,843,000 840,812,000
Diluted weighted average shares . . . 907,259,000 885,819,000 882,947,000 880,843,000 840,812,000
Number of retail drugstores ....... 4,623 4,667 4,714 4,780 4,901
Number of associates ........... 89,000 90,000 91,800 97,500 103,000
25