Rite Aid 2013 Annual Report Download - page 35
Download and view the complete annual report
Please find page 35 of the 2013 Rite Aid annual report below. You can navigate through the pages in the report by either clicking on the pages listed below, or by using the keyword search tool below to find specific information within the annual report.-
 1
1 -
2
-
3
-
4
-
5
-
6
-
7
-
8
-
9
-
10
-
11
-
12
-
13
-
14
-
15
-
16
-
17
-
18
-
19
-
20
-
21
-
22
-
23
-
24
-
 25
25 -
 26
26 -
 27
27 -
 28
28 -
 29
29 -
 30
30 -
 31
31 -
 32
32 -
 33
33 -
 34
34 -
 35
35 -
 36
36 -
 37
37 -
 38
38 -
 39
39 -
 40
40 -
 41
41 -
 42
42 -
 43
43 -
 44
44 -
 45
45 -
46
-
47
-
48
-
49
-
50
-
51
-
52
-
53
-
54
-
55
-
56
-
57
-
58
-
59
-
60
-
61
-
62
-
63
-
64
-
65
-
66
-
67
-
68
-
69
-
70
-
71
-
72
-
73
-
74
-
75
-
76
-
77
-
78
-
79
-
80
-
81
-
82
-
83
-
84
-
85
-
86
-
87
-
88
-
89
-
90
-
91
-
92
-
93
-
94
-
95
-
96
-
97
-
98
-
99
-
100
-
101
-
102
-
103
-
104
-
105
-
106
-
107
-
108
-
109
-
110
-
111
-
112
-
113
-
114
-
115
-
116
-
117
-
118
-
119
-
120
-
121
-
122
-
123
-
124
-
125
 |
 |
The primary drivers of our impairment charges are each store’s current and historical operating
performance and the assumptions that we make about each store’s operating performance in future
periods. Projected cash flows are updated based on the next year’s operating budget which includes the
qualitative factors noted above. We are unable to predict with any degree of certainty which individual
stores will fall short or exceed future operating plans. Accordingly, we are unable to describe future
trends that would affect our impairment charges, including the likely stores and their related asset
values that may fail their recoverability test in future periods.
To the extent that actual future cash flows differ from our projections materially, because of the
reasons discussed above, certain stores that are either not impaired or partially impaired in the current
period may be further impaired in future periods. A 100 basis point decrease in our future sales
assumptions as of March 2, 2013 would have resulted in an additional fiscal 2013 impairment charge of
$13.0 million. A 100 basis point increase in our future sales assumptions as of March 2, 2013 would
have reduced the fiscal 2013 impairment charge by $4.0 million. Changes in our discount rate of 50
basis points would not have a material impact on the total impairment recorded in fiscal 2013.
Lease Termination Charges: Charges to close a store, which principally consist of continuing lease
obligations, are recorded at the time the store is closed and all inventory is liquidated, pursuant to the
guidance set forth in ASC 420, ‘‘Exit or Disposal Cost Obligations.’’ We calculate our liability for
closed stores on a store-by-store basis. The calculation includes the discounted effect of future
minimum lease payments and related ancillary costs, from the date of closure to the end of the
remaining lease term, net of estimated cost recoveries that may be achieved through subletting
properties or through favorable lease terminations. We evaluate these assumptions each quarter and
adjust the liability accordingly. As part of our ongoing business activities, we assess stores and
distribution centers for potential closure. Decisions to close or relocate stores or distribution centers in
future periods would result in lease termination charges for lease exit costs and liquidation of
inventory, as well as impairment of assets at these locations.
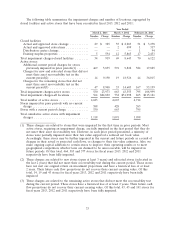
In fiscal 2013, 2012 and 2011, we recorded lease termination charges of $46.0 million, $48.1 million
and $95.8 million. These charges related to changes in future assumptions, interest accretion and
provisions for 14 stores in fiscal 2013, 23 stores in fiscal 2012, and 52 stores and one distribution center
in fiscal 2011.
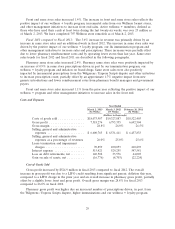
Interest Expense
In fiscal 2013, 2012, and 2011, interest expense was $515.4 million, $529.3 million and
$547.6 million, respectively. The reduction in interest expense in fiscal 2013 compared to fiscal 2012 is
primarily due to one less week in the current year. The reduction in interest expense in fiscal 2012
compared to fiscal 2011 is primarily due to favorable interest rates resulting from our March 2011
Tranche 3 Term Loan refinancing and the August 2010 refinancing of our Tranche 4 Term Loan
partially offset by the impact of the fifty-third week.
The annual weighted average interest rates on our indebtedness in fiscal 2013, 2012 and 2011 were
7.1%, 7.4% and 7.5%, respectively.
Income Taxes
Income tax benefit of $110.6 million, income tax benefit of $23.7 million and income tax expense
of $9.8 million, has been recorded for fiscal 2013, 2012 and 2011, respectively. Net Income for fiscal
2013 included income tax benefit of $110.6 million primarily comprised of adjustments to unrecognized
tax benefits for the appellate settlements of the Brooks Eckerd IRS Audit for the fiscal years
2004 - 2007 and the Commonwealth of Massachusetts Audit for fiscal years 2005 - 2007 as well as for
the lapse of statute of limitations. The appellate settlements as well as the majority of the lapse of
statue of limitations is offset by a reversal of the related tax indemnification asset which was recorded
34