Rite Aid 2013 Annual Report Download - page 25
Download and view the complete annual report
Please find page 25 of the 2013 Rite Aid annual report below. You can navigate through the pages in the report by either clicking on the pages listed below, or by using the keyword search tool below to find specific information within the annual report.-
 1
1 -
2
-
3
-
4
-
5
-
6
-
7
-
8
-
9
-
10
-
11
-
12
-
13
-
14
-
 15
15 -
 16
16 -
 17
17 -
 18
18 -
 19
19 -
 20
20 -
 21
21 -
 22
22 -
 23
23 -
 24
24 -
 25
25 -
 26
26 -
 27
27 -
 28
28 -
 29
29 -
 30
30 -
 31
31 -
 32
32 -
 33
33 -
 34
34 -
 35
35 -
36
-
37
-
38
-
39
-
40
-
41
-
42
-
43
-
44
-
45
-
46
-
47
-
48
-
49
-
50
-
51
-
52
-
53
-
54
-
55
-
56
-
57
-
58
-
59
-
60
-
61
-
62
-
63
-
64
-
65
-
66
-
67
-
68
-
69
-
70
-
71
-
72
-
73
-
74
-
75
-
76
-
77
-
78
-
79
-
80
-
81
-
82
-
83
-
84
-
85
-
86
-
87
-
88
-
89
-
90
-
91
-
92
-
93
-
94
-
95
-
96
-
97
-
98
-
99
-
100
-
101
-
102
-
103
-
104
-
105
-
106
-
107
-
108
-
109
-
110
-
111
-
112
-
113
-
114
-
115
-
116
-
117
-
118
-
119
-
120
-
121
-
122
-
123
-
124
-
125
 |
 |
13APR201302373847
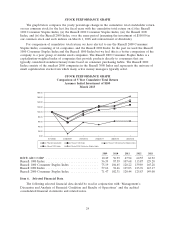
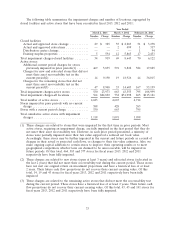
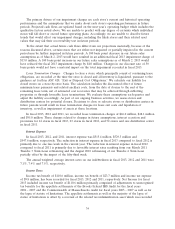
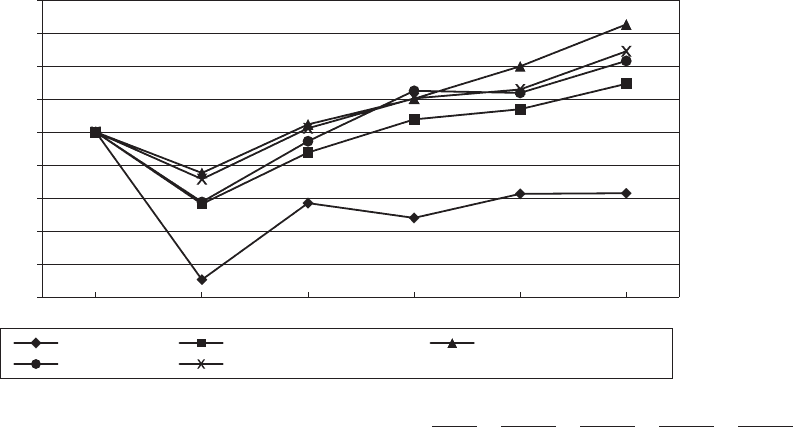
STOCK PERFORMANCE GRAPH
The graph below compares the yearly percentage change in the cumulative total stockholder return
on our common stock for the last five fiscal years with the cumulative total return on (i) the Russell
1000 Consumer Staples Index, (ii) the Russell 2000 Consumer Staples Index, (iii) the Russell 1000
Index, and (iv) the Russell 2000 Index, over the same period (assuming the investment of $100.00 in
our common stock and such indexes on March 1, 2008 and reinvestment of dividends).
For comparison of cumulative total return, we have elected to use the Russell 2000 Consumer
Staples Index, consisting of 66 companies, and the Russell 2000 Index. In the past we used the Russell
1000 Consumer Staples Index and the Russell 1000 Index but we feel this is a better comparison of the
company to a peer group of similar sized companies. The Russell 2000 Consumer Staples Index is a
capitalization-weighted index of companies that provide products directly to consumers that are
typically considered nondiscretionary items based on consumer purchasing habits. The Russell 2000
Index consists of the smallest 2000 companies in the Russell 3000 Index and represents the universe of
small capitalization stocks from which many active money managers typically select.
STOCK PERFORMANCE GRAPH
Comparison of 5 Year Cumulative Total Return
Assumes Initial Investment of $100
March 2013
3/1/2008 3/3/2012 3/2/20132/26/2011
0.00
160.00
120.00
140.00
100.00
80.00
60.00
40.00
20.00
2/28/2009 2/27/2010
180.00
Russell 1000 Consumer Staples IndexRussell 1000 IndexRite Aid Corporation
Russell 2000 Index Russell 2000 Consumer Staples Index
2009 2010 2011 2012 2013
RITE AID CORP .............................. 10.49 56.93 47.94 62.55 62.92
Russell 1000 Index .............................. 56.39 87.59 107.68 113.87 129.28
Russell 1000 Consumer Staples Index ................ 75.19 104.65 120.22 139.89 165.28
Russell 2000 Index .............................. 57.62 94.46 125.03 123.76 143.17
Russell 2000 Consumer Staples Index ................ 71.47 102.31 120.44 125.83 149.00
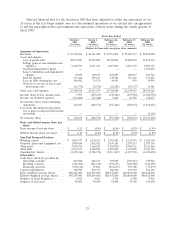
Item 6. Selected Financial Data
The following selected financial data should be read in conjunction with ‘‘Management’s
Discussion and Analysis of Financial Condition and Results of Operations’’ and the audited
consolidated financial statements and related notes.
24