Rite Aid 2013 Annual Report Download - page 63
Download and view the complete annual report
Please find page 63 of the 2013 Rite Aid annual report below. You can navigate through the pages in the report by either clicking on the pages listed below, or by using the keyword search tool below to find specific information within the annual report.-
 1
1 -
2
-
3
-
4
-
5
-
6
-
7
-
8
-
9
-
10
-
11
-
12
-
13
-
14
-
15
-
16
-
17
-
18
-
19
-
20
-
21
-
22
-
23
-
24
-
25
-
26
-
27
-
28
-
29
-
30
-
31
-
32
-
33
-
34
-
35
-
36
-
37
-
38
-
39
-
40
-
41
-
42
-
43
-
44
-
45
-
46
-
47
-
48
-
49
-
50
-
51
-
52
-
 53
53 -
 54
54 -
 55
55 -
 56
56 -
 57
57 -
 58
58 -
 59
59 -
 60
60 -
 61
61 -
 62
62 -
 63
63 -
 64
64 -
 65
65 -
 66
66 -
 67
67 -
 68
68 -
 69
69 -
 70
70 -
 71
71 -
 72
72 -
 73
73 -
74
-
75
-
76
-
77
-
78
-
79
-
80
-
81
-
82
-
83
-
84
-
85
-
86
-
87
-
88
-
89
-
90
-
91
-
92
-
93
-
94
-
95
-
96
-
97
-
98
-
99
-
100
-
101
-
102
-
103
-
104
-
105
-
106
-
107
-
108
-
109
-
110
-
111
-
112
-
113
-
114
-
115
-
116
-
117
-
118
-
119
-
120
-
121
-
122
-
123
-
124
-
125
 |
 |

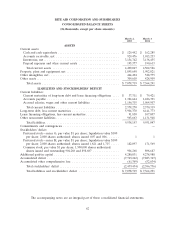
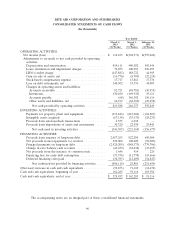
RITE AID CORPORATION AND SUBSIDIARIES
CONSOLIDATED BALANCE SHEETS
(In thousands, except per share amounts)
March 2, March 3,
2013 2012
ASSETS
Current assets:
Cash and cash equivalents ................................... $ 129,452 $ 162,285
Accounts receivable, net .................................... 929,476 1,013,233
Inventories, net ........................................... 3,154,742 3,138,455
Prepaid expenses and other current assets ....................... 195,377 190,613
Total current assets ...................................... 4,409,047 4,504,586
Property, plant and equipment, net .............................. 1,895,650 1,902,021
Other intangibles, net ........................................ 464,404 528,775
Other assets ............................................... 309,618 428,909
Total assets ............................................ $7,078,719 $ 7,364,291
LIABILITIES AND STOCKHOLDERS’ DEFICIT
Current liabilities:
Current maturities of long-term debt and lease financing obligations .... $ 37,311 $ 79,421
Accounts payable ......................................... 1,384,644 1,426,391
Accrued salaries, wages and other current liabilities ................ 1,156,315 1,064,507
Total current liabilities .................................... 2,578,270 2,570,319
Long-term debt, less current maturities ........................... 5,904,370 6,141,773
Lease financing obligations, less current maturities ................... 91,850 107,007
Other noncurrent liabilities .................................... 963,663 1,131,948
Total liabilities .......................................... 9,538,153 9,951,047
Commitments and contingencies ................................ — —
Stockholders’ deficit:
Preferred stock—series G, par value $1 per share; liquidation value $100
per share; 2,000 shares authorized; shares issued .007 and .006 ....... 1 1
Preferred stock—series H, par value $1 per share; liquidation value $100
per share; 2,000 shares authorized; shares issued 1,821 and 1,715 ..... 182,097 171,569
Common stock, par value $1 per share; 1,500,000 shares authorized;
shares issued and outstanding 904,268 and 898,687 ............... 904,268 898,687
Additional paid-in capital ..................................... 4,280,831 4,278,988
Accumulated deficit ......................................... (7,765,262) (7,883,367)
Accumulated other comprehensive loss ........................... (61,369) (52,634)
Total stockholders’ deficit .................................. (2,459,434) (2,586,756)
Total liabilities and stockholders’ deficit ....................... $7,078,719 $ 7,364,291
The accompanying notes are an integral part of these consolidated financial statements.
62