Rite Aid 2013 Annual Report Download - page 30
Download and view the complete annual report
Please find page 30 of the 2013 Rite Aid annual report below. You can navigate through the pages in the report by either clicking on the pages listed below, or by using the keyword search tool below to find specific information within the annual report.-
 1
1 -
2
-
3
-
4
-
5
-
6
-
7
-
8
-
9
-
10
-
11
-
12
-
13
-
14
-
15
-
16
-
17
-
18
-
19
-
 20
20 -
 21
21 -
 22
22 -
 23
23 -
 24
24 -
 25
25 -
 26
26 -
 27
27 -
 28
28 -
 29
29 -
 30
30 -
 31
31 -
 32
32 -
 33
33 -
 34
34 -
 35
35 -
 36
36 -
 37
37 -
 38
38 -
 39
39 -
 40
40 -
41
-
42
-
43
-
44
-
45
-
46
-
47
-
48
-
49
-
50
-
51
-
52
-
53
-
54
-
55
-
56
-
57
-
58
-
59
-
60
-
61
-
62
-
63
-
64
-
65
-
66
-
67
-
68
-
69
-
70
-
71
-
72
-
73
-
74
-
75
-
76
-
77
-
78
-
79
-
80
-
81
-
82
-
83
-
84
-
85
-
86
-
87
-
88
-
89
-
90
-
91
-
92
-
93
-
94
-
95
-
96
-
97
-
98
-
99
-
100
-
101
-
102
-
103
-
104
-
105
-
106
-
107
-
108
-
109
-
110
-
111
-
112
-
113
-
114
-
115
-
116
-
117
-
118
-
119
-
120
-
121
-
122
-
123
-
124
-
125
 |
 |

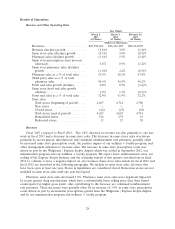
Front end same store sales increased 1.4%. The increase in front end same store sales reflects the
positive impact of our wellness + loyalty program, incremental sales from our Wellness format stores,
and other management initiatives to increase front end sales. Active wellness + members, defined as
those who have used their cards at least twice during the last twenty-six weeks, was over 25 million as
of March 2, 2013. We have completed 797 Wellness store remodels as of March 2, 2013.
Fiscal 2012 compared to Fiscal 2011: The 3.6% increase in revenue was primarily driven by an
increase in same store sales and an additional week in fiscal 2012. The increase in same store sales was
driven by the positive impact of our wellness + loyalty program, our flu immunization program and
other management initiatives to increase sales and prescriptions. These increases were partially offset
due to lower pharmacy reimbursement rates and by operating fewer stores than last year. Same store
sales trends for fiscal 2012 and fiscal 2011 are described in the following paragraphs.
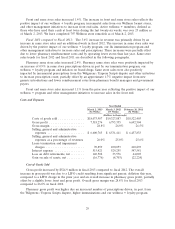
Pharmacy same store sales increased 2.4%. Pharmacy same store sales were positively impacted by
an increase of 0.9% in same store prescriptions driven in part by our immunization program, our
wellness + loyalty program and inflation on brand drugs. Same store sales were also positively
impacted by incremental prescriptions from the Walgreens / Express Scripts dispute and other initiatives
to increase prescription count, partially offset by an approximate 1.7% negative impact from new
generic introductions and lower reimbursement rates from pharmacy benefit managers and government
payors.
Front end same store sales increased 1.1% from the prior year reflecting the positive impact of our
wellness + program and other management initiatives to increase sales in the front end.
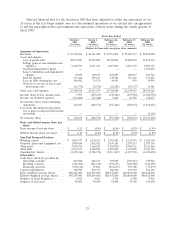
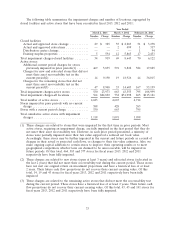
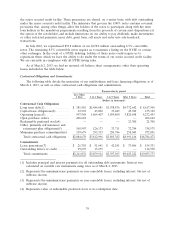
Costs and Expenses
Year Ended
March 2, 2013 March 3, 2012 February 26, 2011
(52 Weeks) (53 Weeks) (52 Weeks)
(Dollars in thousands)
Costs of goods sold ............... $18,073,987 $19,327,887 $18,522,403
Gross profit .................... 7,318,276 6,793,335 6,692,504
Gross margin ................... 28.8% 26.0% 26.5%
Selling, general and administrative
expenses ..................... $ 6,600,765 $ 6,531,411 $ 6,457,833
Selling, general and administrative
expenses as a percentage of revenues 26.0% 25.0% 25.6%
Lease termination and impairment
charges ...................... 70,859 100,053 210,893
Interest expense ................. 515,421 529,255 547,581
Loss on debt retirements, net ........ 140,502 33,576 44,003
Gain on sale of assets, net .......... (16,776) (8,703) (22,224)
Cost of Goods Sold
Gross profit increased by $524.9 million in fiscal 2013 compared to fiscal 2012. The overall
increase in gross profit was due to a LIFO credit resulting from significant generic deflation this year,
compared to a LIFO charge in the prior year and an overall increase in pharmacy gross profit, partially
offset by a slightly lower front end gross profit. Overall gross margin was 28.8% for fiscal 2013
compared to 26.0% in fiscal 2012.
Pharmacy gross profit was higher due an increased number of prescriptions driven, in part, from
the Walgreens / Express Scripts dispute, higher immunizations and our wellness + loyalty program.
29