Rite Aid 2013 Annual Report Download - page 113
Download and view the complete annual report
Please find page 113 of the 2013 Rite Aid annual report below. You can navigate through the pages in the report by either clicking on the pages listed below, or by using the keyword search tool below to find specific information within the annual report.-
 1
1 -
2
-
3
-
4
-
5
-
6
-
7
-
8
-
9
-
10
-
11
-
12
-
13
-
14
-
15
-
16
-
17
-
18
-
19
-
20
-
21
-
22
-
23
-
24
-
25
-
26
-
27
-
28
-
29
-
30
-
31
-
32
-
33
-
34
-
35
-
36
-
37
-
38
-
39
-
40
-
41
-
42
-
43
-
44
-
45
-
46
-
47
-
48
-
49
-
50
-
51
-
52
-
53
-
54
-
55
-
56
-
57
-
58
-
59
-
60
-
61
-
62
-
63
-
64
-
65
-
66
-
67
-
68
-
69
-
70
-
71
-
72
-
73
-
74
-
75
-
76
-
77
-
78
-
79
-
80
-
81
-
82
-
83
-
84
-
85
-
86
-
87
-
88
-
89
-
90
-
91
-
92
-
93
-
94
-
95
-
96
-
97
-
98
-
99
-
100
-
101
-
102
-
 103
103 -
 104
104 -
 105
105 -
 106
106 -
 107
107 -
 108
108 -
 109
109 -
 110
110 -
 111
111 -
 112
112 -
 113
113 -
 114
114 -
 115
115 -
 116
116 -
 117
117 -
 118
118 -
 119
119 -
 120
120 -
 121
121 -
 122
122 -
 123
123 -
124
-
125
 |
 |

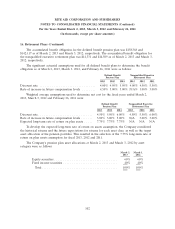
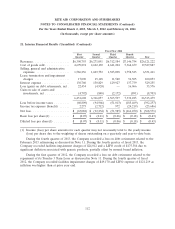
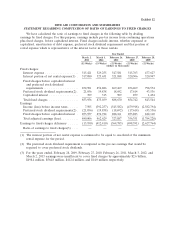
RITE AID CORPORATION AND SUBSIDIARIES
NOTES TO CONSOLIDATED FINANCIAL STATEMENTS (Continued)
For the Years Ended March 2, 2013, March 3, 2012 and February 26, 2011
(In thousands, except per share amounts)
21. Interim Financial Results (Unaudited) (Continued)
Fiscal Year 2012
First Second Third Fourth
Quarter Quarter Quarter Quarter Year
Revenues ..................... $6,390,793 $6,271,091 $6,312,584 $7,146,754 $26,121,222
Cost of goods sold .............. 4,699,874 4,622,130 4,641,204 5,364,679 19,327,887
Selling, general and administrative
expenses ................... 1,586,236 1,603,752 1,583,098 1,758,325 6,531,411
Lease termination and impairment
charges .................... 17,090 15,118 11,540 56,305 100,053
Interest expense ................ 130,760 130,829 129,927 137,739 529,255
Loss (gain) on debt retirements, net . 22,434 (4,924) — 16,066 33,576
Gain on sale of assets and
investments, net .............. (4,792) (848) (2,172) (891) (8,703)
6,451,602 6,366,057 6,363,597 7,332,223 26,513,479
Loss before income taxes ......... (60,809) (94,966) (51,013) (185,469) (392,257)
Income tax expense (benefit) ...... 2,273 (2,712) 972 (24,219) (23,686)
Net loss ...................... $ (63,082) $ (92,254) $ (51,985) $ (161,250) $ (368,571)
Basic loss per share(1) ........... $ (0.07) $ (0.11) $ (0.06) $ (0.18) $ (0.43)
Diluted loss per share(1) ......... $ (0.07) $ (0.11) $ (0.06) $ (0.18) $ (0.43)
(1) Income (loss) per share amounts for each quarter may not necessarily total to the yearly income
(loss) per share due to the weighting of shares outstanding on a quarterly and year-to-date basis.
During the fourth quarter of 2013, the Company recorded a loss on debt retirement related to the
February 2013 refinancing as discussed in Note 11. During the fourth quarter of fiscal 2013, the
Company recorded facilities impairment charges of $24,012 and a LIFO credit of $175,384 due to
significant deflation associated with generic products, partially offset by normal brand inflation.
During the first quarter of 2012, the Company recorded a loss on debt retirement related to the
repayment of its Tranche 3 Term Loan as discussed in Note 11. During the fourth quarter of fiscal
2012, the Company recorded facilities impairment charges of $49,170 and LIFO expense of $121,219 as
inflation was higher than at prior year end.
112