Rite Aid 2013 Annual Report Download - page 41
Download and view the complete annual report
Please find page 41 of the 2013 Rite Aid annual report below. You can navigate through the pages in the report by either clicking on the pages listed below, or by using the keyword search tool below to find specific information within the annual report.-
 1
1 -
2
-
3
-
4
-
5
-
6
-
7
-
8
-
9
-
10
-
11
-
12
-
13
-
14
-
15
-
16
-
17
-
18
-
19
-
20
-
21
-
22
-
23
-
24
-
25
-
26
-
27
-
28
-
29
-
30
-
 31
31 -
 32
32 -
 33
33 -
 34
34 -
 35
35 -
 36
36 -
 37
37 -
 38
38 -
 39
39 -
 40
40 -
 41
41 -
 42
42 -
 43
43 -
 44
44 -
 45
45 -
 46
46 -
 47
47 -
 48
48 -
 49
49 -
 50
50 -
 51
51 -
52
-
53
-
54
-
55
-
56
-
57
-
58
-
59
-
60
-
61
-
62
-
63
-
64
-
65
-
66
-
67
-
68
-
69
-
70
-
71
-
72
-
73
-
74
-
75
-
76
-
77
-
78
-
79
-
80
-
81
-
82
-
83
-
84
-
85
-
86
-
87
-
88
-
89
-
90
-
91
-
92
-
93
-
94
-
95
-
96
-
97
-
98
-
99
-
100
-
101
-
102
-
103
-
104
-
105
-
106
-
107
-
108
-
109
-
110
-
111
-
112
-
113
-
114
-
115
-
116
-
117
-
118
-
119
-
120
-
121
-
122
-
123
-
124
-
125
 |
 |
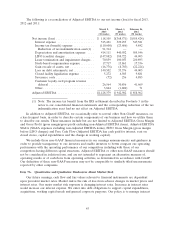
(5) Includes the undiscounted payments for self-insured medical coverage, actuarially determined
undiscounted payments for self-insured workers’ compensation and general liability, and actuarially
determined obligations for defined benefit pension and nonqualified executive retirement plans.
(6) Represents commitments to purchase products and licensing fees from certain vendors.
(7) Represents lease guarantee obligations for 120 former stores related to certain business
dispositions. The respective purchasers assume the obligations and are, therefore, primarily liable
for these obligations.
Obligations for income tax uncertainties pursuant to ASC 740, ‘‘Income Taxes’’ of approximately
$14.7 million are not included in the table above as we are uncertain as to if or when such amounts
may be settled.
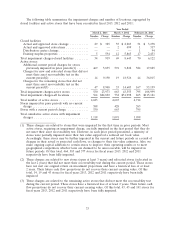
Net Cash Provided By (Used In) Operating, Investing and Financing Activities
Cash flow provided by operating activities was $819.6 million in fiscal 2013. Cash flow was
positively impacted by net income and a reduction of inventory resulting primarily from recent generic
introductions, generic price reductions, management initiatives to reduce inventory levels and fewer
open stores, and a reduction of accounts receivable due to the timing of payments from third party
payors.
Cash flow provided by operating activities was $266.5 million in fiscal 2012. Cash flow was
positively impacted by the reduction in net loss, an increase in accounts payable due to the timing of
purchases partially offset by an increase in inventory resulting primarily from price inflation and
increased store inventory to support sales growth.
Cash flow provided by operating activities was $395.8 million in fiscal 2011. Cash flow was
positively impacted by a reduction in inventory and an increase in accounts payable due to the timing
of purchases. Additionally, the reductions in accounts receivable were no longer offset by repayments to
the receivables securitization facility which was eliminated in the third quarter of fiscal 2010.
Cash used in investing activities was $346.3 million in fiscal 2013. Cash was used for the purchase
of property, plant and equipment and prescriptions files which was partially offset by proceeds from
asset dispositions and sale-leaseback transactions.
Cash used in investing activities was $221.2 million in fiscal 2012. Cash was used for the purchase
of property, plant and equipment and prescription files which was partially offset by proceeds from
asset dispositions and sale-leaseback transactions.
Cash used in investing activities was $156.7 million in fiscal 2011. Cash was used for the purchase
of property, plant and equipment and prescription files which was partially offset by proceeds from
asset dispositions.
Cash used in financing activities was $506.1 million in fiscal 2013 and was primarily due to the
issuance of our $1,161.0 million Tranche 6 Term Loan due 2020, $470.0 million Tranche 1 Term Loan
due 2020 and $426.3 million of our 9.25% Senior Notes due 2020, along with borrowings under our
revolving credit facility of $685.0 million. Proceeds from these issuances were used to repay our
$1,036.3 million Tranche 2 Term Loan due 2014, $470.0 million of our 10.375% Senior Secured Notes
due 2016, $410.0 million of our 9.750% Senior Secured Notes due 2016, our $330.9 million Tranche 5
Term Loan due 2018, $405.0 million of our 9.375% Senior Notes due 2015, $54.2 million of our 8.625%
Senior Notes due 2015, 6.0 million of our 9.25% Senior Notes due 2013. We also made scheduled
payments of $18.5 million and $9.0 million of our capital lease obligations and our Tranche 2 and
Tranche 5 Term Loans, respectively. Additionally, we incurred financing fees for early debt retirement
of $75.4 million and cash paid for deferred financing costs of $54.8 million in connection with the
above transactions.
40