Qantas 2011 Annual Report Download - page 22
Download and view the complete annual report
Please find page 22 of the 2011 Qantas annual report below. You can navigate through the pages in the report by either clicking on the pages listed below, or by using the keyword search tool below to find specific information within the annual report.-
 1
1 -
2
-
3
-
4
-
5
-
6
-
7
-
8
-
9
-
10
-
11
-
 12
12 -
 13
13 -
 14
14 -
 15
15 -
 16
16 -
 17
17 -
 18
18 -
 19
19 -
 20
20 -
 21
21 -
 22
22 -
 23
23 -
 24
24 -
 25
25 -
 26
26 -
 27
27 -
 28
28 -
 29
29 -
 30
30 -
 31
31 -
 32
32 -
33
-
34
-
35
-
36
-
37
-
38
-
39
-
40
-
41
-
42
-
43
-
44
-
45
-
46
-
47
-
48
-
49
-
50
-
51
-
52
-
53
-
54
-
55
-
56
-
57
-
58
-
59
-
60
-
61
-
62
-
63
-
64
-
65
-
66
-
67
-
68
-
69
-
70
-
71
-
72
-
73
-
74
-
75
-
76
-
77
-
78
-
79
-
80
-
81
-
82
-
83
-
84
-
85
-
86
-
87
-
88
-
89
-
90
-
91
-
92
-
93
-
94
-
95
-
96
-
97
-
98
-
99
-
100
-
101
-
102
-
103
-
104
-
105
-
106
-
107
-
108
-
109
-
110
-
111
-
112
-
113
-
114
-
115
-
116
-
117
-
118
-
119
-
120
-
121
-
122
-
123
-
124
 |
 |

THE QANTAS GROUP 20
for the year ended 30 June 2011
Review of Operations continued
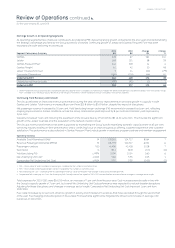
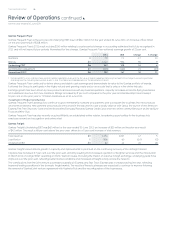
Qantas Frequent Flyer
Qantas Frequent Flyer achieved a record Underlying EBIT result of $ million for the year ended June , an increase of $ million
on the prior year result of $ million.
Qantas Frequent Flyer’s result includes $ million relating to a prior period change in accounting estimates that is fully recognised in
and will not impact future periods. Normalised for this change, Qantas Frequent Flyer achieved earnings growth of per cent.
Change % Change
Members M. . .
Billings $M ,
Underlying EBIT $M
Normalisation adjustment $M () () ()
Normalised EBIT$M
. Normalised EBIT is a non-statutory measure which restates redemption revenue to the fair value of awards redeemed (removing the impact of the change in accounting estimate)
and recognises the marketing revenue when a point is sold. This creates a comparable basis for the presentation of results.
Qantas Frequent Flyer continued to deliver strong and stable cash earnings and demonstrate its value to the Qantas portfolio of brands.
It allowed the Group to participate in the highly valued and growing loyalty sector on a scale that is unique in the airline industry.
Earnings growth has been driven by new products and services with key business partners, capacity increases across the ying businesses
and additional revenue from new members. Billings increased by per cent compared to the prior year and membership has increased
per cent on the prior year to . million members as at June .
Investment in Product and Service
Qantas Frequent Flyer’s strategy is to continue to grow membership numbers and partners, and to broaden the business into new products
and revenue streams. New partners and products announced in the last year include a loyalty alliance with Optus, the launch of the American
Express Fee Free Discovery Card and the Woolworths Everyday Rewards Qantas Credit Card, and new online communities such as the epiQure
Food and Wine Club.
Qantas Frequent Flyer has also recently acquired Wishlist, an established online retailer, broadening opportunities for the business into
employee reward and recognition and online retail.
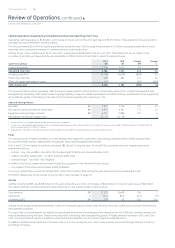
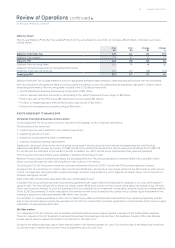
Qantas Freight
Qantas Freight’s Underlying EBIT was $ million for the year ended June , an increase of $ million on the prior year result
of $ million. The result is per cent above the prior year, driven by a per cent increase in total revenue.
Total revenue $M , ,
Load factor %. (.) ()
Underlying EBIT $M
Qantas Freight’s result reects growth in capacity and improvements in yield built on the continuing recovery of the airfreight market.
Capacity has increased . per cent over the prior year, primarily resulting from increased operation of freighter services and the introduction
in March of a larger B operating on trans-Tasman routes. Excluding the impact of adverse foreign exchange, underlying yields have
improved over the prior year, reecting better market conditions and increased airfreight activity across the network.
The contributions from the joint venture businesses Australia air Express and Star Track Express also increased during the year, reecting
improved trading conditions in the domestic freight market. The results of these businesses are expected to continue to improve following
the renewal of Qantas’ joint venture agreement with Australia Post and the reconguration of the businesses.