Qantas 2011 Annual Report Download - page 118
Download and view the complete annual report
Please find page 118 of the 2011 Qantas annual report below. You can navigate through the pages in the report by either clicking on the pages listed below, or by using the keyword search tool below to find specific information within the annual report.-
 1
1 -
2
-
3
-
4
-
5
-
6
-
7
-
8
-
9
-
10
-
11
-
12
-
13
-
14
-
15
-
16
-
17
-
18
-
19
-
20
-
21
-
22
-
23
-
24
-
25
-
26
-
27
-
28
-
29
-
30
-
31
-
32
-
33
-
34
-
35
-
36
-
37
-
38
-
39
-
40
-
41
-
42
-
43
-
44
-
45
-
46
-
47
-
48
-
49
-
50
-
51
-
52
-
53
-
54
-
55
-
56
-
57
-
58
-
59
-
60
-
61
-
62
-
63
-
64
-
65
-
66
-
67
-
68
-
69
-
70
-
71
-
72
-
73
-
74
-
75
-
76
-
77
-
78
-
79
-
80
-
81
-
82
-
83
-
84
-
85
-
86
-
87
-
88
-
89
-
90
-
91
-
92
-
93
-
94
-
95
-
96
-
97
-
98
-
99
-
100
-
101
-
102
-
103
-
104
-
105
-
106
-
107
-
 108
108 -
 109
109 -
 110
110 -
 111
111 -
 112
112 -
 113
113 -
 114
114 -
 115
115 -
 116
116 -
 117
117 -
 118
118 -
 119
119 -
 120
120 -
 121
121 -
 122
122 -
 123
123 -
 124
124
 |
 |

THE QANTAS GROUP 116
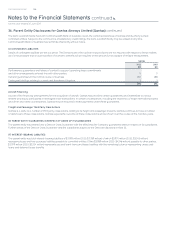
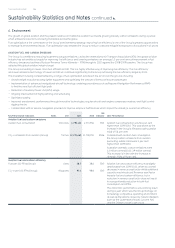
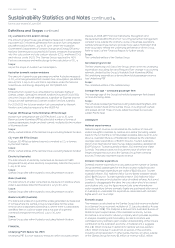
Sustainability Statistics and Notes continued
The Group makes a direct contribution to national export revenue by bringing overseas visitors into Australia and to domestic and regional
tourism by carrying passengers within Australia. The Group also makes an indirect contribution to the Australian economy in the form of
ow-on effect on all sectors in the economy.
Key Performance Indicators Notes Unit
GRI
Indicator Performance
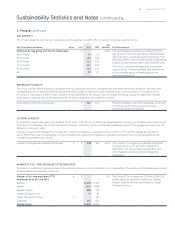
Tourism spending by Qantas Group passengers $M
National export revenue , , EC In /, the Group made a direct
contribution to national export revenue
of $. billion, per cent higher than
/. This improvement is driven by
an increase in the number of international
visitors brought to Australia by the Group.
Domestic traveller expenditure , , EC The Group’s contribution to domestic traveller
expenditure was per cent higher than
/. This improvement is driven by
an per cent increase in the number of
domestic passengers carried by Qantas
Group carriers, offset by a per cent decrease
in the average expenditure per visitor.
Indirect $M
Economic output , , EC The Group’s indirect contribution to the
Australian economy was $ billion,
per cent higher than /.
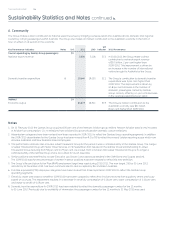
Notes
. On February the Qantas Group acquired per cent of the Network Aviation group entities. Network Aviation data is only included
in Aviation fuel consumption, CO-e emissions from aviation (Group) and Australian domestic carbon emissions.
. Absenteeism categories have been revised from those reported in / to reect the Qantas Group operating segments. In addition,
the / absenteeism for the Qantas Group has been revised from . to . to reect the revised Jetstar reporting scope which now
includes Australian and New Zealand-based employees.
. This performance indicator also includes Jetset Travelworld Group for the period it was a controlled entity of the Qantas Group. The merger
of Jetset Travelworld Group with Stella Travel Services on September resulted in the Qantas Group’s shareholding in Jetset
Travelworld Group reducing from per cent to per cent. As a result, from October Jetset Travelworld Group is no longer a
controlled entity of the Qantas Group and is accounted for as an associate.
. Senior positions was redened to include Executive Job Grade and above (as detailed in the Denitions and Scopes section).
The / data for the percentage of women in senior positions has been restated to reect this new denition.
. The Group’s Reconciliation Action Plan (RAP) employment target was reset during /. The new target, by June
and by December , has been communicated to and accepted by Reconciliation Australia.
. Full-time equivalent (FTE) employee categories have been revised from those reported in / to reect the Qantas Group
operating segments.
. Electricity, water and waste to landll for / have been updated to reect nal invoices received from suppliers, where previously
based on accruals. The restatement resulted in a decrease in electricity consumption of . per cent, water consumption of . per cent
and waste to landll of . per cent.
. Domestic traveller expenditure for / has been restated to reect the domestic passenger number for the months
to June . Previously due to availability of information, the passenger number for the months to May was used.
6. Community