Qantas 2011 Annual Report Download - page 10
Download and view the complete annual report
Please find page 10 of the 2011 Qantas annual report below. You can navigate through the pages in the report by either clicking on the pages listed below, or by using the keyword search tool below to find specific information within the annual report.-
 1
1 -
 2
2 -
 3
3 -
 4
4 -
 5
5 -
 6
6 -
 7
7 -
 8
8 -
 9
9 -
 10
10 -
 11
11 -
 12
12 -
 13
13 -
 14
14 -
 15
15 -
 16
16 -
 17
17 -
 18
18 -
 19
19 -
 20
20 -
 21
21 -
22
-
23
-
24
-
25
-
26
-
27
-
28
-
29
-
30
-
31
-
32
-
33
-
34
-
35
-
36
-
37
-
38
-
39
-
40
-
41
-
42
-
43
-
44
-
45
-
46
-
47
-
48
-
49
-
50
-
51
-
52
-
53
-
54
-
55
-
56
-
57
-
58
-
59
-
60
-
61
-
62
-
63
-
64
-
65
-
66
-
67
-
68
-
69
-
70
-
71
-
72
-
73
-
74
-
75
-
76
-
77
-
78
-
79
-
80
-
81
-
82
-
83
-
84
-
85
-
86
-
87
-
88
-
89
-
90
-
91
-
92
-
93
-
94
-
95
-
96
-
97
-
98
-
99
-
100
-
101
-
102
-
103
-
104
-
105
-
106
-
107
-
108
-
109
-
110
-
111
-
112
-
113
-
114
-
115
-
116
-
117
-
118
-
119
-
120
-
121
-
122
-
123
-
124
 |
 |

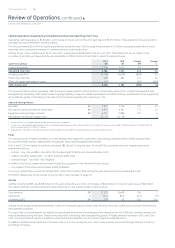
THE QANTAS GROUP 8
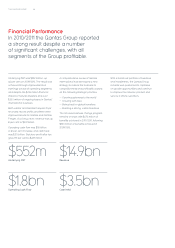
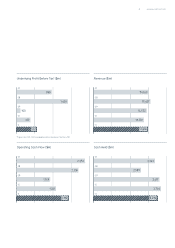
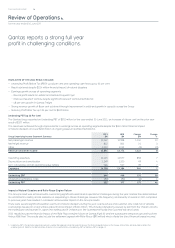
Underlying PBT was $552 million, up
46 per cent on 2009/2010. The result was
achieved through improvements in
earnings across all operating segments
and despite the $224 million nancial
impact of natural disasters and over
$200 million of ongoing losses in Qantas’
international business.
Both Jetstar and Qantas Frequent Flyer
recorded record prots and there were
improved results for Qantas and Qantas
Freight. At a Group level, revenue was up
8 per cent to $14.9 billion.
Operating cash ow was $1.8 billion,
a 32 per cent increase, and cash held
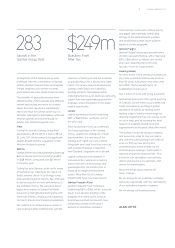
was $3.5 billion. Statutory prot after tax
grew 115 per cent to $249 million.
A comprehensive review of Qantas
International has developed a new
strategy to restore the business to
competitiveness and protability based
on the following strategic priorities:
— Opening gateways to the world
— Growing with Asia
— Being best for global travellers
— Building a strong, viable business
The QFuture business change program
remains on track with $470 million of
benets achieved in 2010/2011, following
$533 million of benets achieved in
2009/2010.
With a balanced portfolio of business
and investments, the Qantas Group
remains well-positioned to capitalise
on growth opportunities and continue
to improve the network, product and
service it offers customers.
Financial Performance
In 2010/2011 the Qantas Group reported
a strong result despite a number
of signicant challenges, with all
segments of the Group protable.
$552m
$1.8bn
$14.9bn
$3.5bn
Underlying PBT
Operating Cash Flow
Revenue
Cash Held