Qantas 2011 Annual Report Download - page 117
Download and view the complete annual report
Please find page 117 of the 2011 Qantas annual report below. You can navigate through the pages in the report by either clicking on the pages listed below, or by using the keyword search tool below to find specific information within the annual report.-
 1
1 -
2
-
3
-
4
-
5
-
6
-
7
-
8
-
9
-
10
-
11
-
12
-
13
-
14
-
15
-
16
-
17
-
18
-
19
-
20
-
21
-
22
-
23
-
24
-
25
-
26
-
27
-
28
-
29
-
30
-
31
-
32
-
33
-
34
-
35
-
36
-
37
-
38
-
39
-
40
-
41
-
42
-
43
-
44
-
45
-
46
-
47
-
48
-
49
-
50
-
51
-
52
-
53
-
54
-
55
-
56
-
57
-
58
-
59
-
60
-
61
-
62
-
63
-
64
-
65
-
66
-
67
-
68
-
69
-
70
-
71
-
72
-
73
-
74
-
75
-
76
-
77
-
78
-
79
-
80
-
81
-
82
-
83
-
84
-
85
-
86
-
87
-
88
-
89
-
90
-
91
-
92
-
93
-
94
-
95
-
96
-
97
-
98
-
99
-
100
-
101
-
102
-
103
-
104
-
105
-
106
-
 107
107 -
 108
108 -
 109
109 -
 110
110 -
 111
111 -
 112
112 -
 113
113 -
 114
114 -
 115
115 -
 116
116 -
 117
117 -
 118
118 -
 119
119 -
 120
120 -
 121
121 -
 122
122 -
 123
123 -
 124
124
 |
 |

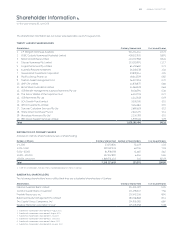
115 ANNUAL REPORT 2011
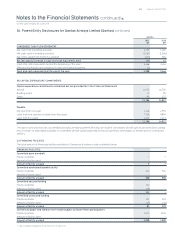
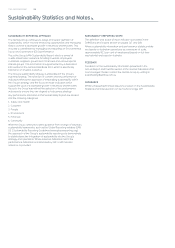
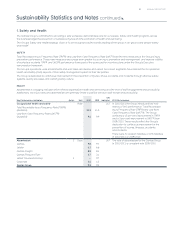
Sustainability Statistics and Notes continued
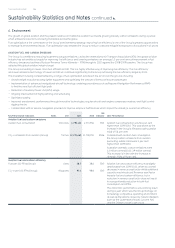
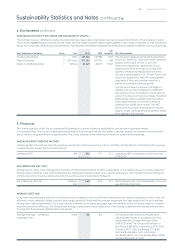
AUSTRALIAN ELECTRICITY USE, WATER USE AND WASTE TO LANDFILL
The Qantas Group is committed to being an environmentally responsible organisation across all levels and functions of the business. A set of
Group-wide begreen targets for electricity use, water use and waste reduction has brought together a wide range of activities across all business
areas, from corporate ofces to ground operations. Tracking this consumption facilitates the monitoring of operational efciency and cost savings.
Key Performance Indicators Notes Unit
GRI
Indicator Performance
Electricity (Australia) MWh , , EN The Group progressed well towards meeting its
/ electricity, water and waste reduction
targets, achieving , and per cent
reductions respectively, against the Group
targets which have been set on a /
baseline. Whilst these results fall short of the
Group’s original targets of , and per cent
reductions respectively (set with a zero growth
assumption), they are excellent results in a
period of continued business growth.
The Group achieved a reduction of waste to
landll by per cent compared to /.
This was driven by an initiative to divert general
waste in Sydney to an Advance Waste Treatment
(AWT) facility, which commenced in November
. Approximately tonnes of waste is
diverted from landll each month. The AWT
facility sorts recyclable material and composts
organic waste, allowing almost all general waste
from Sydney to be recycled.
Water (Australia) ’ Litres , , EN
Waste to landll (Australia) Tonnes , , EN
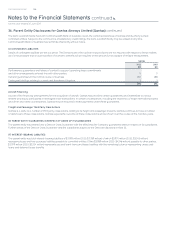
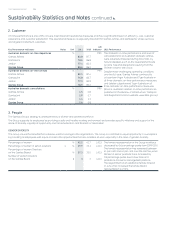
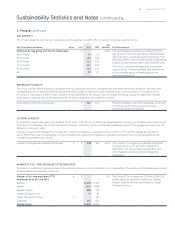
5. Financial
The utmost objective of the Group’s sustainability strategy is to achieve nancial sustainability and provide sustainable returns
to its shareholders. The Group’s sustainability performance in the areas of health and safety, customer, people, environment and community
are all linked to long-term nancial sustainability. The Group focuses on the following key nancial sustainability measures:
UNDERLYING PROFIT BEFORE TAX PBT:
Underlying PBT is the primary reporting measure used by the Qantas Group’s Executive Committee and the Board of Directors for the purpose
of assessing the Group’s nancial performance.
Underlying PBT $M EC Underlying PBT increased by per cent from
/.
NET UNDERLYING UNIT COST:
Minimising unit cost is a key management indicator of nancial performance and the sustainability of the Qantas Group. It involves constantly
nding ways to minimise costs while maintaining the highest standards of safety and customer experience. Unit cost performance forms part
of the scorecard for incentive plans under the Group’s Executive remuneration framework.
Net Underlying Unit Cost Cents per
ASK
. . EC Net Underlying Unit Cost increased by . cents
per ASK from /.
AVERAGE FLEET AGE:
Long–term eet planning is essential to aviation success. Investing in new aircraft drives improvements in safety, passenger comfort, cost, fuel
efciency, noise, emissions, freight capacity and range capability. Monitoring the average passenger eet age assists the Group to manage
its long-term capital requirement. The Group’s priority is renewal of its scheduled passenger aircraft eet, which will directly improve customer
experience and fuel efciency. The Group’s eet strategy supports the Group’s objectives of two strong complementary brands and provides
for long-term eet renewal, simplication and growth.
Average eet age – scheduled
passenger eet
Years . . The Group’s eet renewal during the year
absorbed the impact of a passing year and
maintained the average eet age at the
/ level. The Group took delivery of
four Airbus A-s, three Airbus A-s,
Airbus A-s, ve Boeing -s
and one Bombardier Q, and retired
one Boeing B-, one Boeing B-ER
and two Boeing B-s.
4. Environment continued