Qantas 2011 Annual Report Download - page 116
Download and view the complete annual report
Please find page 116 of the 2011 Qantas annual report below. You can navigate through the pages in the report by either clicking on the pages listed below, or by using the keyword search tool below to find specific information within the annual report.-
 1
1 -
2
-
3
-
4
-
5
-
6
-
7
-
8
-
9
-
10
-
11
-
12
-
13
-
14
-
15
-
16
-
17
-
18
-
19
-
20
-
21
-
22
-
23
-
24
-
25
-
26
-
27
-
28
-
29
-
30
-
31
-
32
-
33
-
34
-
35
-
36
-
37
-
38
-
39
-
40
-
41
-
42
-
43
-
44
-
45
-
46
-
47
-
48
-
49
-
50
-
51
-
52
-
53
-
54
-
55
-
56
-
57
-
58
-
59
-
60
-
61
-
62
-
63
-
64
-
65
-
66
-
67
-
68
-
69
-
70
-
71
-
72
-
73
-
74
-
75
-
76
-
77
-
78
-
79
-
80
-
81
-
82
-
83
-
84
-
85
-
86
-
87
-
88
-
89
-
90
-
91
-
92
-
93
-
94
-
95
-
96
-
97
-
98
-
99
-
100
-
101
-
102
-
103
-
104
-
105
-
 106
106 -
 107
107 -
 108
108 -
 109
109 -
 110
110 -
 111
111 -
 112
112 -
 113
113 -
 114
114 -
 115
115 -
 116
116 -
 117
117 -
 118
118 -
 119
119 -
 120
120 -
 121
121 -
 122
122 -
 123
123 -
 124
124
 |
 |

THE QANTAS GROUP 114
Sustainability Statistics and Notes continued
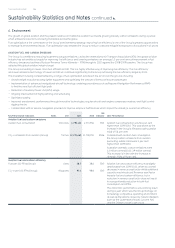
The growth of global aviation and the present reliance on traditional aviation fuel means growing industry carbon emissions during a period
when emissions reductions are being mandated across the globe.
Fuel optimisation is the cornerstone of the Group’s environmental strategy. Improving fuel efciency is one of the Group’s greatest opportunities
to manage its environmental impact. Fuel optimisation also enables the Group to reduce costs and mitigate its exposure to uctuations in oil prices.
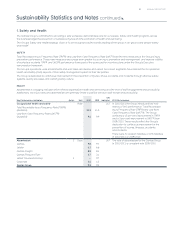
AVIATION FUEL AND CARBON EMISSIONS
The Group is committed to reducing its greenhouse gas emissions. Led by the International Air Transport Association (IATA), the global aviation
industry has set ambitious targets for improving fuel efciency and lowering emissions: an average . per cent annual improvement in fuel
efciency (measured as litres of fuel per Revenue Tonne Kilometre – RTK) through to against the / baseline. The Group has
adopted this global aviation industry target.
The Group is investing in newer, more fuel efcient aircraft. This is a highly effective way of improving fuel efciency. The fuel efciency
and lower emissions technology of newer aircraft will contribute signicantly to the Group achieving the fuel efciency target by .
This investment is being complemented by a range of fuel optimisation activities in the air and on the ground, including:
— Aircraft weight reductions (using lighter equipment and optimising the amount of items carried per passenger)
— Implementation of advanced navigational aircraft technology, enabling procedures such as Required Navigation Performance (RNP)
to nd the most fuel efcient ight path
— Reduction of Auxiliary Power Unit (APU) usage
— Ongoing improvement of ight planning and scheduling
— Optimised loading
— Improved aerodynamic performance through innovative technologies, regular aircraft and engine compressor washes, and ight control
rigging checks
— Collaboration with air service navigation providers to improve airspace inefciencies which impact the industry’s overall fuel efciency
Key Performance Indicators Notes Unit
GRI
Indicator Performance
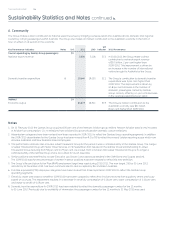
Aviation fuel and carbon emissions
Aviation fuel consumption ’ Litres ,, ,, EN Aviation fuel consumption was ve per cent
higher than /. This was driven by the
increase in the Group’s ASKs (excluding Jetstar
Asia) of . per cent.
CO-e emissions from aviation (Group) Tonnes ,, ,, EN Consistent with aviation fuel consumption,
the Group carbon emissions from aviation
(excluding Jetstar Asia) were per cent
higher than /.
Australian domestic carbon emissions were
. million tonnes (: . million tonnes).
This increase is in line with the increase in
domestic ASKs of per cent.
Aviation fuel and carbon efciency
Fuel per RTKs (Group) Litres . . EN Aviation fuel and carbon efciency has slightly
deteriorated from /, driven by a small
decrease in revenue seat factor whilst additional
capacity was introduced. Revenue seat factor
impacts fuel and carbon efciency, but a
reduction in revenue seat factor does not result
in a proportionate reduction in both fuel
consumption and RTKs.
The / performance was a strong result
during a year which saw the Group manage an
increasingly competitive operating environment,
as well as disruptions caused by natural disasters
such as the Queensland oods, Cyclone Yasi
and the Chilean volcanic ash cloud.
CO-e per RTKs (Group) Kilograms . . EN
4. Environment