Porsche 2010 Annual Report Download - page 48
Download and view the complete annual report
Please find page 48 of the 2010 Porsche annual report below. You can navigate through the pages in the report by either clicking on the pages listed below, or by using the keyword search tool below to find specific information within the annual report.-
 1
1 -
2
-
3
-
4
-
5
-
6
-
7
-
8
-
9
-
10
-
11
-
12
-
13
-
14
-
15
-
16
-
17
-
18
-
19
-
20
-
21
-
22
-
23
-
24
-
25
-
26
-
27
-
28
-
29
-
30
-
31
-
32
-
33
-
34
-
35
-
36
-
37
-
 38
38 -
 39
39 -
 40
40 -
 41
41 -
 42
42 -
 43
43 -
 44
44 -
 45
45 -
 46
46 -
 47
47 -
 48
48 -
 49
49 -
 50
50 -
 51
51 -
 52
52 -
 53
53 -
 54
54 -
 55
55 -
 56
56 -
 57
57 -
 58
58 -
59
-
60
-
61
-
62
-
63
-
64
-
65
-
66
-
67
-
68
-
69
-
70
-
71
-
72
-
73
-
74
-
75
-
76
-
77
-
78
-
79
-
80
-
81
-
82
-
83
-
84
-
85
-
86
-
87
-
88
-
89
-
90
-
91
-
92
-
93
-
94
-
95
-
96
-
97
-
98
-
99
-
100
-
101
-
102
-
103
-
104
-
105
-
106
-
107
-
108
-
109
-
110
-
111
-
112
-
113
-
114
-
115
-
116
-
117
-
118
-
119
-
120
-
121
-
122
-
123
-
124
-
125
-
126
-
127
-
128
-
129
-
130
-
131
-
132
-
133
-
134
-
135
-
136
-
137
-
138
-
139
-
140
-
141
-
142
-
143
-
144
-
145
-
146
-
147
-
148
-
149
-
150
-
151
-
152
-
153
-
154
-
155
-
156
-
157
-
158
-
159
-
160
-
161
-
162
-
163
-
164
-
165
-
166
-
167
-
168
-
169
-
170
-
171
-
172
-
173
-
174
-
175
-
176
-
177
-
178
-
179
-
180
-
181
-
182
-
183
-
184
-
185
-
186
-
187
-
188
-
189
-
190
-
191
-
192
-
193
-
194
-
195
-
196
-
197
-
198
-
199
-
200
-
201
-
202
-
203
-
204
-
205
-
206
-
207
-
208
-
209
-
210
-
211
-
212
-
213
-
214
-
215
-
216
-
217
-
218
-
219
-
220
-
221
-
222
-
223
-
224
-
225
-
226
-
227
-
228
-
229
-
230
-
231
-
232
-
233
-
234
-
235
-
236
-
237
-
238
-
239
 |
 |

Group management report
During the reporting period, the crisis in the
international automotive markets was already a thing
of the past. The global automobile market grew by
12 percent in 2010, with 61.7 million cars sold –
topping pre-crisis levels. This growth was driven
mainly by extremely high demand in the BRIC states
of Brazil, Russia, India and China. According to the
German Association of the Automobile Industry (VDA),
sales in China rose by 34 percent to 11.3 million
vehicles. In India, the increase was 31 percent to 2.4
million units; in Russia, 30 percent to 1.9 million
vehicles; and in Brazil, 11 percent to 3.3 million units.
The American market also contributed to overall
growth worldwide, with sales of new passenger cars
and light trucks increasing by eleven percent to
11.6 million vehicles.
However, global sports cars sales saw less
than average benefits from the renewed overall de-
mand for cars, as the sports car segments are still
considerably smaller in the BRIC states, which are
driving growth in the world automobile market, than
in the mature markets.
In Germany, only 2.9 million new vehicles
were sold in 2010; the marked fall in comparison to
the prior-year figure (3.8 million passenger cars) was
due to the scrappage bonus granted in 2009. As
expected, the number of new vehicles registered in
western Europe as a whole fell by five percent to just
under 13 million units in the wake of the expiration of
economic rescue programs. When government re-
covery programs came to an end, the sales markets
returned to their pre-crisis structure. In Germany, it
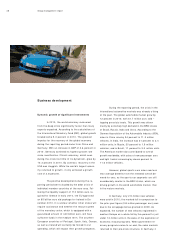
Business development
Dynamic growth of significant investments
In 2010, the world economy recovered
from the deep crisis significantly faster than many
experts expected. According to the calculations of
the International Monetary Fund (IMF), global growth
totaled some 5.0 percent in 2010. The greatest
impetus for the recovery of the global economy
during the reporting period came from China and
Germany. With an increase in GDP of 3.6 percent in
2010, Germany achieved its highest growth rate
since reunification. China’s economy, which even
during the crisis lost little of its dynamism, grew by
10.3 percent in 2010. By contrast, recovery in the
USA was sluggish. While the world’s largest econo-
my returned to growth, it only achieved a growth
rate of 2.8 percent.
The positive developments during the re-
porting period were clouded by the debt crisis of
individual member countries of the euro area. Fol-
lowing the liquidity support of 110 billion euro re-
quired for Greece in early 2010, the EU approved
an 85 billion euro aid package for Ireland in De-
cember 2010. It is unclear whether other states will
require assistance and whether the rescue system
of the monetary union, which is equipped with a
guaranteed amount of 440 billion euro, will have
sufficient funds in the medium term. The southern
European countries of Portugal, Spain, Italy, Greece,
as well as Ireland will certainly be forced to cut
spending, which will impact their growth prospects.
46