Porsche 2010 Annual Report Download - page 193
Download and view the complete annual report
Please find page 193 of the 2010 Porsche annual report below. You can navigate through the pages in the report by either clicking on the pages listed below, or by using the keyword search tool below to find specific information within the annual report.-
 1
1 -
2
-
3
-
4
-
5
-
6
-
7
-
8
-
9
-
10
-
11
-
12
-
13
-
14
-
15
-
16
-
17
-
18
-
19
-
20
-
21
-
22
-
23
-
24
-
25
-
26
-
27
-
28
-
29
-
30
-
31
-
32
-
33
-
34
-
35
-
36
-
37
-
38
-
39
-
40
-
41
-
42
-
43
-
44
-
45
-
46
-
47
-
48
-
49
-
50
-
51
-
52
-
53
-
54
-
55
-
56
-
57
-
58
-
59
-
60
-
61
-
62
-
63
-
64
-
65
-
66
-
67
-
68
-
69
-
70
-
71
-
72
-
73
-
74
-
75
-
76
-
77
-
78
-
79
-
80
-
81
-
82
-
83
-
84
-
85
-
86
-
87
-
88
-
89
-
90
-
91
-
92
-
93
-
94
-
95
-
96
-
97
-
98
-
99
-
100
-
101
-
102
-
103
-
104
-
105
-
106
-
107
-
108
-
109
-
110
-
111
-
112
-
113
-
114
-
115
-
116
-
117
-
118
-
119
-
120
-
121
-
122
-
123
-
124
-
125
-
126
-
127
-
128
-
129
-
130
-
131
-
132
-
133
-
134
-
135
-
136
-
137
-
138
-
139
-
140
-
141
-
142
-
143
-
144
-
145
-
146
-
147
-
148
-
149
-
150
-
151
-
152
-
153
-
154
-
155
-
156
-
157
-
158
-
159
-
160
-
161
-
162
-
163
-
164
-
165
-
166
-
167
-
168
-
169
-
170
-
171
-
172
-
173
-
174
-
175
-
176
-
177
-
178
-
179
-
180
-
181
-
182
-
 183
183 -
 184
184 -
 185
185 -
 186
186 -
 187
187 -
 188
188 -
 189
189 -
 190
190 -
 191
191 -
 192
192 -
 193
193 -
 194
194 -
 195
195 -
 196
196 -
 197
197 -
 198
198 -
 199
199 -
 200
200 -
 201
201 -
 202
202 -
 203
203 -
204
-
205
-
206
-
207
-
208
-
209
-
210
-
211
-
212
-
213
-
214
-
215
-
216
-
217
-
218
-
219
-
220
-
221
-
222
-
223
-
224
-
225
-
226
-
227
-
228
-
229
-
230
-
231
-
232
-
233
-
234
-
235
-
236
-
237
-
238
-
239
 |
 |

191
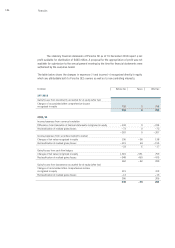
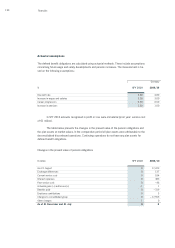
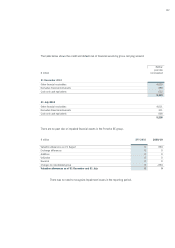
Development of plan assets
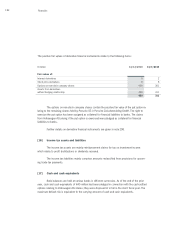
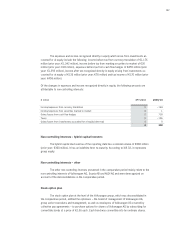
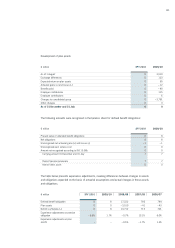
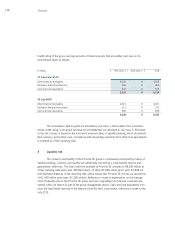
The following amounts were recognized in the balance sheet for defined benefit obligations:
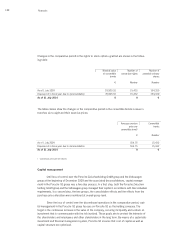
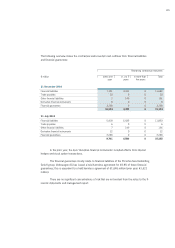
The table below presents experience adjustments, meaning differences between changes in assets
and obligations expected on the basis of actuarial assumptions and actual changes in those assets
and obligations.
€ million SFY 2010 2009/10
As of 1 August 0 3,510
Exchange differences 0 123
Expected return on plan assets 0 85
Actuarial gains (+) and losses (–) 0 – 12
Benefits paid 0 – 49
Employer contributions 0 115
Employee contributions 0 6
Changes to consolidated group 0 – 3,781
Other changes 0 3
As of 31 December and 31 July 0 0
€ million SFY 2010 2009/10
Present value of unfunded benefit obligations 8 8
Net obligations 8 8
Unrecognized net actuarial gains (+) and losses (–) – 1 – 1
Unrecognized past service cost 0 0
Amount not recognized according to IAS 19.58b 0 0
Carrying amount 31 December and 31 July 7 7
thereof pension provisions 7 7
thereof other asset 0 0
€ million SFY 2010 2009/10 2008/09 2007/08 2006/07
Defined benefit obligation 8 8 17,222 760 744
Plan assets 0 0 – 3,510 – 41 – 43
Deficit (+)/Surplus (–) 8 8 13,712 719 701
Experience adjustments on pension
obligation – 8.8% 1.7% – 0.7% 13.1% 6.0%
Experience adjustments on plan
assets – – – 0.5% – 1.7% 1.3%