Porsche 2010 Annual Report Download - page 173
Download and view the complete annual report
Please find page 173 of the 2010 Porsche annual report below. You can navigate through the pages in the report by either clicking on the pages listed below, or by using the keyword search tool below to find specific information within the annual report.-
 1
1 -
2
-
3
-
4
-
5
-
6
-
7
-
8
-
9
-
10
-
11
-
12
-
13
-
14
-
15
-
16
-
17
-
18
-
19
-
20
-
21
-
22
-
23
-
24
-
25
-
26
-
27
-
28
-
29
-
30
-
31
-
32
-
33
-
34
-
35
-
36
-
37
-
38
-
39
-
40
-
41
-
42
-
43
-
44
-
45
-
46
-
47
-
48
-
49
-
50
-
51
-
52
-
53
-
54
-
55
-
56
-
57
-
58
-
59
-
60
-
61
-
62
-
63
-
64
-
65
-
66
-
67
-
68
-
69
-
70
-
71
-
72
-
73
-
74
-
75
-
76
-
77
-
78
-
79
-
80
-
81
-
82
-
83
-
84
-
85
-
86
-
87
-
88
-
89
-
90
-
91
-
92
-
93
-
94
-
95
-
96
-
97
-
98
-
99
-
100
-
101
-
102
-
103
-
104
-
105
-
106
-
107
-
108
-
109
-
110
-
111
-
112
-
113
-
114
-
115
-
116
-
117
-
118
-
119
-
120
-
121
-
122
-
123
-
124
-
125
-
126
-
127
-
128
-
129
-
130
-
131
-
132
-
133
-
134
-
135
-
136
-
137
-
138
-
139
-
140
-
141
-
142
-
143
-
144
-
145
-
146
-
147
-
148
-
149
-
150
-
151
-
152
-
153
-
154
-
155
-
156
-
157
-
158
-
159
-
160
-
161
-
162
-
 163
163 -
 164
164 -
 165
165 -
 166
166 -
 167
167 -
 168
168 -
 169
169 -
 170
170 -
 171
171 -
 172
172 -
 173
173 -
 174
174 -
 175
175 -
 176
176 -
 177
177 -
 178
178 -
 179
179 -
 180
180 -
 181
181 -
 182
182 -
 183
183 -
184
-
185
-
186
-
187
-
188
-
189
-
190
-
191
-
192
-
193
-
194
-
195
-
196
-
197
-
198
-
199
-
200
-
201
-
202
-
203
-
204
-
205
-
206
-
207
-
208
-
209
-
210
-
211
-
212
-
213
-
214
-
215
-
216
-
217
-
218
-
219
-
220
-
221
-
222
-
223
-
224
-
225
-
226
-
227
-
228
-
229
-
230
-
231
-
232
-
233
-
234
-
235
-
236
-
237
-
238
-
239
 |
 |

171
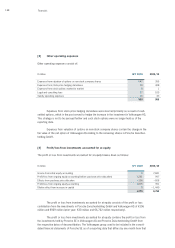
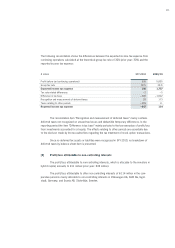
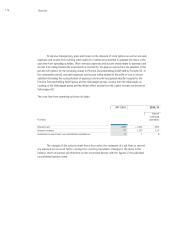
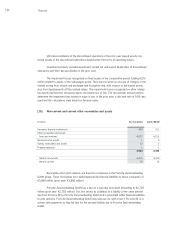
The following reconciliation shows the differences between the expected income tax expense from
continuing operations calculated at the theoretical group tax rate of 30% (prior year: 30%) and the
reported income tax expense:
The reconciliation item “Recognition and measurement of deferred taxes” mainly contains
deferred taxes not recognized on unused tax losses and deductible temporary differences. In the
reporting period the item “Difference in tax base” mainly pertains to the tax exemption of profit/loss
from investments accounted for at equity. The effects relating to other periods are essentially due
to the decision made by the tax authorities regarding the tax treatment of stock option transactions.
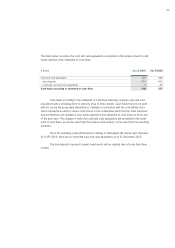
Since no deferred tax assets or liabilities were recognized in SFY 2010, no breakdown of
deferred taxes by balance sheet item is presented.
[8] Profit/loss attributable to non-controlling interests
The profit/loss attributable to non-controlling interests, which is allocable to the investors in
hybrid capital, amounts to €11 million (prior year: €39 million).
The profit/loss attributable to other non-controlling interests of €-114 million in the com-
parative period is mainly allocable to non-controlling interests in Volkswagen AG, AUDI AG, Ingol-
stadt, Germany, and Scania AB, Södertälje, Sweden.
€ million SFY 2010 2009/10
Profit before tax (continuing operations) 639 5,855
Group tax rate 30 % 30 %
Expected income tax expense 192 1,757
Tax rate related differences – 2 – 5
Difference in tax base – 206 – 1,822
Recognition and measurement of deferred taxes 28 173
Taxes relating to other periods – 659 11
Reported income tax expense – 647 114