Porsche 2010 Annual Report Download - page 206
Download and view the complete annual report
Please find page 206 of the 2010 Porsche annual report below. You can navigate through the pages in the report by either clicking on the pages listed below, or by using the keyword search tool below to find specific information within the annual report.-
 1
1 -
2
-
3
-
4
-
5
-
6
-
7
-
8
-
9
-
10
-
11
-
12
-
13
-
14
-
15
-
16
-
17
-
18
-
19
-
20
-
21
-
22
-
23
-
24
-
25
-
26
-
27
-
28
-
29
-
30
-
31
-
32
-
33
-
34
-
35
-
36
-
37
-
38
-
39
-
40
-
41
-
42
-
43
-
44
-
45
-
46
-
47
-
48
-
49
-
50
-
51
-
52
-
53
-
54
-
55
-
56
-
57
-
58
-
59
-
60
-
61
-
62
-
63
-
64
-
65
-
66
-
67
-
68
-
69
-
70
-
71
-
72
-
73
-
74
-
75
-
76
-
77
-
78
-
79
-
80
-
81
-
82
-
83
-
84
-
85
-
86
-
87
-
88
-
89
-
90
-
91
-
92
-
93
-
94
-
95
-
96
-
97
-
98
-
99
-
100
-
101
-
102
-
103
-
104
-
105
-
106
-
107
-
108
-
109
-
110
-
111
-
112
-
113
-
114
-
115
-
116
-
117
-
118
-
119
-
120
-
121
-
122
-
123
-
124
-
125
-
126
-
127
-
128
-
129
-
130
-
131
-
132
-
133
-
134
-
135
-
136
-
137
-
138
-
139
-
140
-
141
-
142
-
143
-
144
-
145
-
146
-
147
-
148
-
149
-
150
-
151
-
152
-
153
-
154
-
155
-
156
-
157
-
158
-
159
-
160
-
161
-
162
-
163
-
164
-
165
-
166
-
167
-
168
-
169
-
170
-
171
-
172
-
173
-
174
-
175
-
176
-
177
-
178
-
179
-
180
-
181
-
182
-
183
-
184
-
185
-
186
-
187
-
188
-
189
-
190
-
191
-
192
-
193
-
194
-
195
-
 196
196 -
 197
197 -
 198
198 -
 199
199 -
 200
200 -
 201
201 -
 202
202 -
 203
203 -
 204
204 -
 205
205 -
 206
206 -
 207
207 -
 208
208 -
 209
209 -
 210
210 -
 211
211 -
 212
212 -
 213
213 -
 214
214 -
 215
215 -
 216
216 -
217
-
218
-
219
-
220
-
221
-
222
-
223
-
224
-
225
-
226
-
227
-
228
-
229
-
230
-
231
-
232
-
233
-
234
-
235
-
236
-
237
-
238
-
239
 |
 |
Financials
204
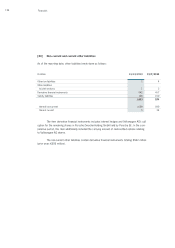
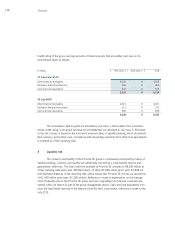
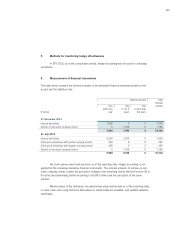
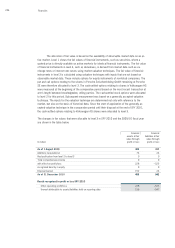
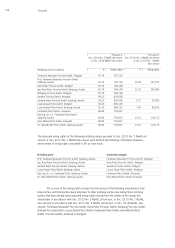
The market value of financial instruments is determined by reference to stock market listings, refer-
ence prices or generally accepted valuation models such as the discounted cash flow method. The
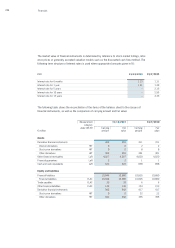
following term structure of interest rates is used where appropriate (amounts given in %):
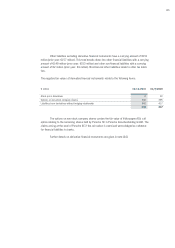
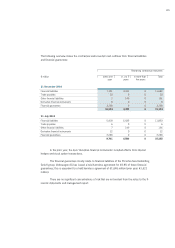
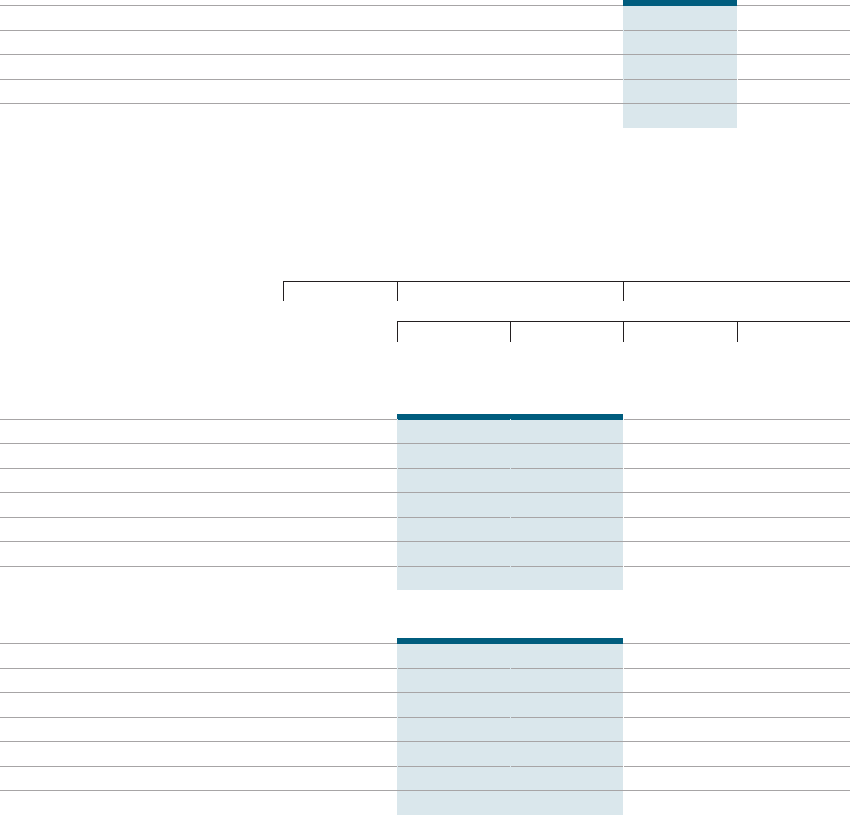
The following table shows the reconciliation of the items of the balance sheet to the classes of
financial instruments, as well as the comparison of carrying amount and fair value:
EUR 31/12/2010 31/7/2010
Interest rate for 6 months 1.23 1.11
Interest rate for 1 year 1.51 1.39
Interest rate for 5 years – 2.15
Interest rate for 10 years – 2.95
Interest rate for 15 years – 3.33
Measurement 31/12/2010 31/7/2010
category
under IAS 39 Carrying Fair Carrying Fair
€ million amount value amount value
Assets
Derivative financial instruments 459 459 311 311
Interest derivatives HfT 0 0 2 2
Stock price derivatives HfT 0 0 8 8
Other derivatives HfT 459 459 301 301
Other financial receivables LaR 4,027 4,027 4,020 4,020
Financial guarantees LaR 2 2 1 1
Cash and cash equivalents LaR 622 622 898 898
Equity and liabilities
Financial liabilities 10,844 10,880 10,825 10,880
Financial liabilities FLAC 10,844 10,880 10,825 10,880
Trade payables FLAC 33 33 6 6
Other financial liabilities FLAC 149 149 153 153
Derivative financial instruments 942 942 417 417
Stock price derivatives HfT 0 0 22 22
Other derivatives HfT 942 942 395 395