Porsche 2010 Annual Report Download - page 2
Download and view the complete annual report
Please find page 2 of the 2010 Porsche annual report below. You can navigate through the pages in the report by either clicking on the pages listed below, or by using the keyword search tool below to find specific information within the annual report.-
 1
1 -
 2
2 -
 3
3 -
 4
4 -
 5
5 -
 6
6 -
 7
7 -
 8
8 -
 9
9 -
 10
10 -
 11
11 -
 12
12 -
 13
13 -
14
-
15
-
16
-
17
-
18
-
19
-
20
-
21
-
22
-
23
-
24
-
25
-
26
-
27
-
28
-
29
-
30
-
31
-
32
-
33
-
34
-
35
-
36
-
37
-
38
-
39
-
40
-
41
-
42
-
43
-
44
-
45
-
46
-
47
-
48
-
49
-
50
-
51
-
52
-
53
-
54
-
55
-
56
-
57
-
58
-
59
-
60
-
61
-
62
-
63
-
64
-
65
-
66
-
67
-
68
-
69
-
70
-
71
-
72
-
73
-
74
-
75
-
76
-
77
-
78
-
79
-
80
-
81
-
82
-
83
-
84
-
85
-
86
-
87
-
88
-
89
-
90
-
91
-
92
-
93
-
94
-
95
-
96
-
97
-
98
-
99
-
100
-
101
-
102
-
103
-
104
-
105
-
106
-
107
-
108
-
109
-
110
-
111
-
112
-
113
-
114
-
115
-
116
-
117
-
118
-
119
-
120
-
121
-
122
-
123
-
124
-
125
-
126
-
127
-
128
-
129
-
130
-
131
-
132
-
133
-
134
-
135
-
136
-
137
-
138
-
139
-
140
-
141
-
142
-
143
-
144
-
145
-
146
-
147
-
148
-
149
-
150
-
151
-
152
-
153
-
154
-
155
-
156
-
157
-
158
-
159
-
160
-
161
-
162
-
163
-
164
-
165
-
166
-
167
-
168
-
169
-
170
-
171
-
172
-
173
-
174
-
175
-
176
-
177
-
178
-
179
-
180
-
181
-
182
-
183
-
184
-
185
-
186
-
187
-
188
-
189
-
190
-
191
-
192
-
193
-
194
-
195
-
196
-
197
-
198
-
199
-
200
-
201
-
202
-
203
-
204
-
205
-
206
-
207
-
208
-
209
-
210
-
211
-
212
-
213
-
214
-
215
-
216
-
217
-
218
-
219
-
220
-
221
-
222
-
223
-
224
-
225
-
226
-
227
-
228
-
229
-
230
-
231
-
232
-
233
-
234
-
235
-
236
-
237
-
238
-
239
 |
 |

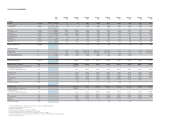
Porsche group highlights
1 The years up until 2007/08 have been adjusted according to the share split in fiscal year 2000/01 and 2007/08.
2 Incl. figures from discontinued operations of CTS group
3 Cayman from fiscal year 2005/06
4 Continuing operations (figures adjusted for the fiscal year 2008/09)
5 Vehicles sales and production figures are not presented for fiscal year 2009/10
due to the deconsolidation of the former subgroups Porsche and Volkswagen in the fiscal year 2009/10.
6 A proposal for the appropriation of profit was not available for submission to the annual general meeting by the time the financial statements
were authorized by the executive board.
2010 2009/10 2008/09 2007/08 2006/07 2005/06 2004/05 2003/04 2002/03 2001/02
IFRS IFRS IFRS IFRS IFRS IFRS IFRS IFRS HGB HGB
Financials
Revenue € million 0 0
4 0
4 7,4 66 7,3 68 7, 273
2 6,574 6,148 5,583 4,857
thereof domestic € million 0 0
4 0
4 1,365 1,326 1,234 1,267 1,214 1,483 1,121
thereof export € million 0 0
4 0
4 6,101 6,042 6,039 5,307 4,934 4,100 3,736
Total assets € million 29,666 28,152 213,565 45,577 23,332 14,641 9,710 9,014 6,315 5,409
Shareholders’ equity € million 17,214 15,197 48,479 16,846 9,481 5,338 3,420 2,921 1,755 1,467
Fixed assets € million 24,258 22,707 85,066 11,168 9,760 5,681 2,428 2,380 2,663 2,208
Capital expenditures € million 0 21,964 22,410 1,383 3,881 4,083 919 1,111 1,295 1,120
Personnel expenses € million 11 17
4 74
4 1,359 1,264 1,037 965 950 850 799
Depreciation € million 0 0
4 0
4 569 532 489 511 382 392 279
Income before tax € million 639 5,855
4 –2,559
4 8,569 5,857 2,110
2 1,238 1,137 933 829
Net income € million 1,286 454 –3,563 6,392 4,242 1,393
2 779 690 565 462
Dividends paid in total € million
6 17 8 472 385 157 87 70 59 297
Dividends per share1
Ordinary share €
6 0.094 0.044 0.694 +2.00 0.694+1.50 0.594 +0.30 0.494 0.394 0.334 0.294+1.40
Preference share €
6 0.10 0.050 0.700 +2.00 0.700 +1.50 0.600+ 0.30 0.5 0.4 0.34 0.300 +1.40
Earnings per ordinary share1 € 7.28 32.67
4 –13.68
4 35.943 23.98 7.81 4.468 3.963 – –
Earnings per preference share1 € 7.29 32.68
4 –13.67
4 35.949 23.986 7.822 4.474 3.969 – –
Employees (at year-end) number 36 37 375,959 12,202 11,571 11,384 11,878 11,668 10,699 10,143
Vehicle sales (new cars) total5 units – – 3,082,837 98,652 97,515 96,794 88,379 76,827 66,803 54,234
thereof vehicle sales (new cars) Volkswagen group5 units – – 3,007,599 – – – – – – –
thereof vehicle sales (new cars)
Porsche Zwischenholding GmbH group5 units – – 75,238 98,652 97,515 96,794 88,379 76,827 66,803 54,234
Domestic Porsche5 units – – 12,291 13,524 14,314 13,921 13,902 12,176 13,896 12,825
Export Porsche5 units – – 62,947 85,128 83,201 82,873 74,477 64,651 52,907 41,409
9115 units – – 27,070 31,423 37,415 34,386 27,826 23,704 27,789 32,337
Boxster/Cayman3,5 units – – 13,140 21,747 26,146 27,906 18,009 12,988 18,411 21,897
Cayenne5 units – – 34,265 45,478 33,943 34,134 41,884 39,913 20,603 –
Panamera5 units – – 763 0 – – – – – –
Carrera GT & RS Spyder5 units – – 0 4 11 368 660 222 – –
Production total5 units – – 2,899,388 105,162 101,844 102,602 90,954 81,531 73,284 55,050
thereof production Volkswagen group5 units – – 2,822,649 – – – – – – –
thereof production
Porsche Zwischenholding GmbH group5 units – – 76,739 105,162 101,844 102,602 90,954 81,531 73,284 55,050
9115 units – – 27,776 34,303 38,959 36,504 28,619 26,650 29,564 33,061
Boxster/Cayman3,5 units – – 14,403 22,356 26,712 30,680 20,321 13,462 18,788 21,989
Cayenne5 units – – 32,640 48,497 36,169 35,128 41,299 41,149 24,925 –
Panamera5 units – – 1,920 3 – – – – – –
Carrera GT & RS Spyder5 units – – 0 3 4 290 715 270 7 –