Lululemon 2014 Annual Report Download - page 62
Download and view the complete annual report
Please find page 62 of the 2014 Lululemon annual report below. You can navigate through the pages in the report by either clicking on the pages listed below, or by using the keyword search tool below to find specific information within the annual report.-
 1
1 -
2
-
3
-
4
-
5
-
6
-
7
-
8
-
9
-
10
-
11
-
12
-
13
-
14
-
15
-
16
-
17
-
18
-
19
-
20
-
21
-
22
-
23
-
24
-
25
-
26
-
27
-
28
-
29
-
30
-
31
-
32
-
33
-
34
-
35
-
36
-
37
-
38
-
39
-
40
-
41
-
42
-
43
-
44
-
45
-
46
-
47
-
48
-
49
-
50
-
51
-
 52
52 -
 53
53 -
 54
54 -
 55
55 -
 56
56 -
 57
57 -
 58
58 -
 59
59 -
 60
60 -
 61
61 -
 62
62 -
 63
63 -
 64
64 -
 65
65 -
 66
66 -
 67
67 -
 68
68 -
 69
69 -
 70
70 -
 71
71 -
 72
72 -
73
-
74
-
75
-
76
-
77
-
78
-
79
-
80
-
81
-
82
-
83
-
84
-
85
-
86
-
87
-
88
-
89
-
90
-
91
-
92
-
93
-
94
-
95
-
96
 |
 |

Table of Contents
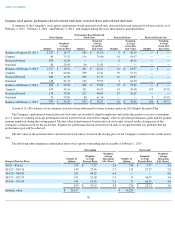
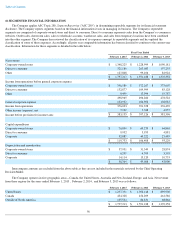
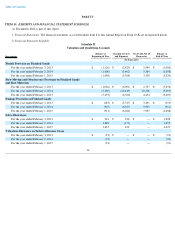
16 SEGMENTED FINANCIAL INFORMATION
The Company applies ASC Topic 280, Segment Reporting ("ASC 280"), in determining reportable segments for its financial statement
disclosure. The Company reports segments based on the financial information it uses in managing its business. The Company's reportable
segments are comprised of corporate-owned stores and direct to consumer. Direct to consumer represents sales from the Company's e-commerce
websites. Outlet sales, showroom sales, sales to wholesale accounts, warehouse sales, and sales from temporary locations have been combined
into the other segment. The Company has reviewed the classification of its expenses amongst its reportable segments and has updated the
classification of some of these expenses. Accordingly, all prior year comparable information has been reclassified to conform to the current year
classification. Information for these segments is detailed in the table below:
Intercompany amounts are excluded from the above table as they are not included in the materials reviewed by the Chief Operating
Decision Maker.
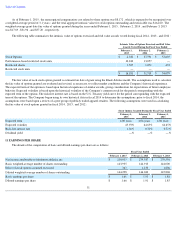
The Company operates in five geographic areas—Canada, the United States, Australia and New Zealand, Europe, and Asia. Net revenue
from these regions for the years ended February 1, 2015 , February 2, 2014 , and February 3, 2013 was as follows:
56
Fiscal Year Ended
February 1, 2015
February 2, 2014
February 3, 2013
Net revenue
Corporate-owned stores
$
1,348,225
$
1,228,999
$
1,090,181
Direct to consumer
321,180
263,083
197,255
Other
127,808
99,106
82,922
$
1,797,213
$
1,591,188
$
1,370,358
Income from operations before general corporate expense
Corporate-owned stores
$
356,589
$
372,267
$
373,607
Direct to consumer
132,877
109,999
85,128
Other
9,499
13,994
19,787
498,965
496,260
478,522
General corporate expense
122,932
104,902
102,083
Income from operations
376,033
391,358
376,439
Other income (expense), net
7,102
5,768
4,957
Income before provision for income taxes
$
383,135
$
397,126
$
381,396
Capital expenditures
Corporate-owned stores
$
76,894
$
60,233
$
64,863
Direct to consumer
9,952
5,953
4,881
Corporate
32,887
40,222
23,485
$
119,733
$
106,408
$
93,229
Depreciation and amortization
Corporate-owned stores
$
37,951
$
31,349
$
28,874
Direct to consumer
6,299
4,599
3,393
Corporate
14,114
13,120
10,733
$
58,364
$
49,068
$
43,000
February 1, 2015
February 2, 2014
February 3, 2013
United States
$
1,257,351
$
1,052,148
$
839,908
Canada
434,328
454,209
461,586
Outside of North America
105,534
84,831
68,864
$
1,797,213
$
1,591,188
$
1,370,358