Lululemon 2014 Annual Report Download - page 32
Download and view the complete annual report
Please find page 32 of the 2014 Lululemon annual report below. You can navigate through the pages in the report by either clicking on the pages listed below, or by using the keyword search tool below to find specific information within the annual report.-
 1
1 -
2
-
3
-
4
-
5
-
6
-
7
-
8
-
9
-
10
-
11
-
12
-
13
-
14
-
15
-
16
-
17
-
18
-
19
-
20
-
21
-
 22
22 -
 23
23 -
 24
24 -
 25
25 -
 26
26 -
 27
27 -
 28
28 -
 29
29 -
 30
30 -
 31
31 -
 32
32 -
 33
33 -
 34
34 -
 35
35 -
 36
36 -
 37
37 -
 38
38 -
 39
39 -
 40
40 -
 41
41 -
 42
42 -
43
-
44
-
45
-
46
-
47
-
48
-
49
-
50
-
51
-
52
-
53
-
54
-
55
-
56
-
57
-
58
-
59
-
60
-
61
-
62
-
63
-
64
-
65
-
66
-
67
-
68
-
69
-
70
-
71
-
72
-
73
-
74
-
75
-
76
-
77
-
78
-
79
-
80
-
81
-
82
-
83
-
84
-
85
-
86
-
87
-
88
-
89
-
90
-
91
-
92
-
93
-
94
-
95
-
96
 |
 |

Table of Contents
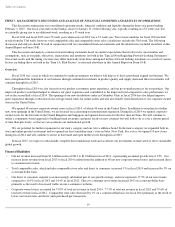
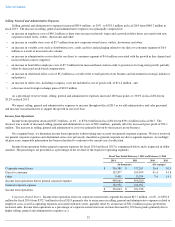
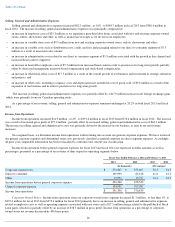
Selling, General and Administrative Expenses
Selling, general and administrative expenses increased $62.3 million , or 16% , to $448.7 million in fiscal 2013 from $386.4 million in
fiscal 2012 . The increase in selling, general and administrative expenses was principally comprised of:
The increase in selling, general and administrative expenses was partially offset by a $17.9 million increase in net foreign exchange gains
which were primarily from our Canadian operating entity.
As a percentage of net revenue, selling, general and administrative expenses remained unchanged at 28.2% in both fiscal 2013 and fiscal
2012 .
Income from Operations
Income from operations increased $14.9 million , or 4% , to $391.4 million in fiscal 2013 from $376.4 million in fiscal 2012 . The
increase
was a result of increased gross profit of $77.2 million , partially offset by increased selling, general and administrative costs of $62.3 million .
The increase in selling, general and administrative costs was primarily driven by the increase in our business, as seen in our net revenue
increases.
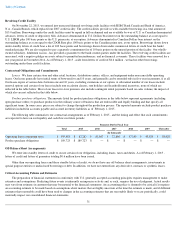
On a segment basis, we determine income from operations without taking into account our general corporate expenses. We have reviewed
our general corporate expenses and determined some costs previously classified as general corporate are direct segment expenses. Accordingly,
all prior year comparable information has been reclassified to conform to the current year classification.
Income from operations before general corporate expenses for fiscal 2013 and fiscal 2012 are expressed in dollar amounts as well as
percentages, presented as a percentage of net revenue of their respective operating segments below.
Corporate-Owned Stores. Income from operations from our corporate-owned stores segment decreased $1.3 million , or less than 1%, to
$372.3 million for fiscal 2013 from $373.6 million for fiscal 2012 primarily due to an increase in selling, general and administrative expenses
related to employee costs as well as operating expenses associated with new stores and a $17.5 million charge related to the pull-back of black
Luon pants, which was partially offset by an increase of $38.3 million in gross profit. Income from operations as a percentage of corporate-
owned stores net revenue decreased by 400 basis points
26
• an increase in employee costs of $25.3 million as we experience growth in labor hours associated with new and existing corporate-owned
stores, outlets, showrooms and other, as well as an increase in wages as we invest in our employees;
• an increase in variable store costs of $9.5 million from new and existing corporate-
owned stores, outlets, showrooms and other;
• an increase in variable costs such as distribution costs, credit card fees and packaging related to our direct to consumer segment of $7.3
million as a result of increased sales volume;
• an increase in administrative costs related to our direct to consumer segment of $5.3 million associated with the growth in this channel and
increased head count to support it;
• an increase in head office employee costs of $5.7 million from increased head count in order to position us for long-term growth, partially
offset by decreased management incentive-based compensation and stock-based compensation;
• an increase in other head office costs of $17.5 million
as a result of the overall growth of our business and investment in strategic initiatives
and projects; and
• an increase in other costs, including occupancy costs and depreciation not included in cost of goods sold, of $9.6 million as a result of the
expansion of our business and in order to position us for long-term growth.
Fiscal Year Ended February 2, 2014 and February 3, 2013
2013
2012
2013
2012
(In thousands)
(Percentages)
Corporate-owned stores
$
372,267
$
373,607
30.3
34.3
Direct to consumer
109,999
85,128
41.8
43.2
Other
13,994
19,787
14.1
23.9
Income from operations before general corporate expense
496,260
478,522
General corporate expense
104,902
102,083
Income from operations
$
391,358
$
376,439